
Arithmetic gives us tools to smoosh, slide and stretch numbers. These transformations are handy: sometimes there’s things in the real world we want to smoosh, slide and stretch in the same way.
Why’s this important?
Seeing arithmetic as a type of transformation prepares you to make sense of seemingly-weird concepts, like the square root of -1, and visualize problems in a new way. Let’s take a look.
Addition
Addition is simple, yet it can mean several things:
- Accumulate: Count up similar quantities (often for tangible items).
- Slide: Shifting a number along a scale (for less tangible things, like temperature).
- Combine: Make a new quantity out of two different ones (like notes in a music chord).
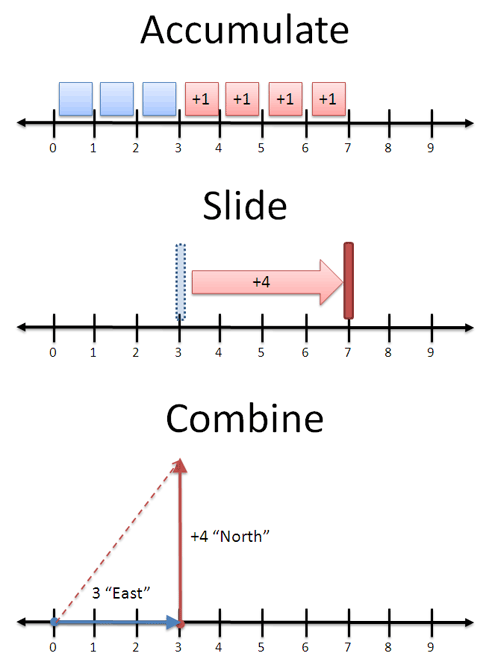
What’s the right meaning? It depends on the context. When adding apples, we count up similar items (3 apples + 4 apples = 7 apples). When measuring temperature, we add heat to move along a scale (3 degrees + 4 degrees = 7 degrees).
When adding vectors, a combination makes the most sense: 3 blocks east + 4 blocks north = 5 blocks in a new direction (“as the crow flies” distance). In this case, you must track the component parts, keeping “North” and “East” separate. When adding apples, you can combine everything: once you have 7, you don’t care that it was once 3 and 4.
A single operation (addition) can take on several intuitive meanings. This list isn’t exhaustive — they are the interactions I’ve noticed, and I’m sure you have others.
Multiplication
Multiplication can also be interpreted in several ways:
- Repetition: Performing multiple additions.
- Scaling: Making a number grow or shrink all at once.
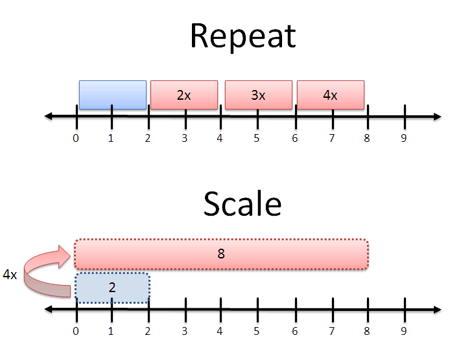
Context determines our meaning. With apples, “4x” means turning an order of 2 apples into an order of 8 (4 groups of 2). With photo software, “4x” means expanding a 2-inch photo to be 8 inches long. Each meaning is different: you’d be annoyed if I gave you a giant, 5-lb apple or 4 separate photos.
In a narrow sense, multiplication is “repeated addition”. Sure. But that’s not always the easiest interpretation — care to “repeatedly add” 7.3 times?
Negatives and Inverses
Negatives and inverses both represent the idea of “reverse” or “opposite”. But that’s ambiguous: What’s the opposite of multiplying by two?
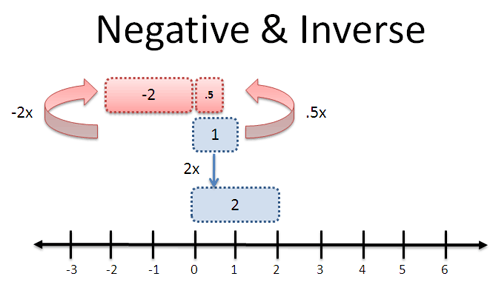
“Opposite” can mean a few things:
- Multiply by 1/2: Turn a profit of 1 into a profit of 1/2 (“unscale” it)
- Multiply by -2: Turn a profit of 1 into a loss of 2 (flip it)
Yet again, our context determines meaning. When a company “reverses a gain” it implies a loss, aka multiplying by a negative. When we “reverse a zoom” in photo software, we want to shrink the photo (not mirror-image it), so we multiply by 1/2. Context, context, context (tired of that word yet?).
When adding, there’s only one type of opposite: the reverse of +8 is -8. But the trick is to know that -8 really means “0-8″ or even “0 + (-8)”: you’re moving backwards relative to some reference point. Moving “in reverse” means different things depending if your original direction was East or North.
What’s in an equation?
Equations ask questions. When you see

It’s more than just a plug and chug problem. Think about the question like this:

What transformation (“times x”), when applied twice, will turn 1 into 9?
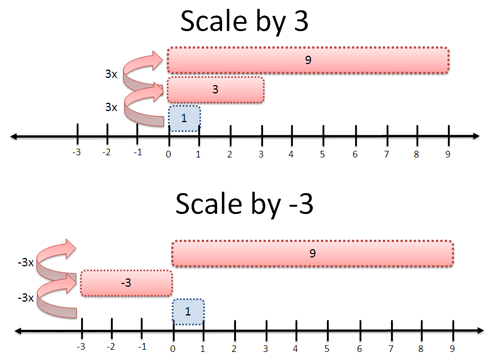
We have two answers:
- Scale by 3 (times 3): Do it twice and you’ll get 9: 1 * 3 * 3 = 9
- Scale by 3 and flip (times -3): Done twice, you get 9 also: 1 * -3 * -3 = 9
Nifty. I included “1″ to show what is being transformed. Sure, it’s optional, but it’s not something we think about. What is the “times 3″ acting on?
Stepping back this way, we can see arithmetic as a method to push, pull, tug and squeeze one number into another. We’ve managed to turn one large transformation (“times 9″) into two equal, smaller ones (“times -3″ or “times 3″).
Real-World Example: Random Numbers
Enough theory — let’s show this mindset in action. Most programming languages offer a random() function that gives a number from 0 to 1. But what if you want something from 5-10?
The question is: how do I transform my range of 0-1 into a range from 5-10?
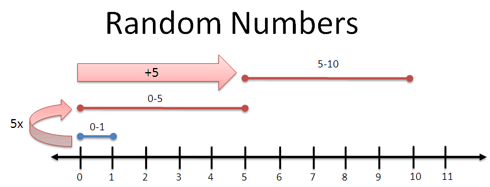
Arithmetic to the rescue!
- First, you stretch 0-1 into 0-5 by multiplying by 5
- Next, slide 0-5 to 5-10 by adding 5
- And tada. You have a range from 5-10.
Try it out below. You start with a number “r” and transform it into the proper range.
By the way, this range could be the ages 18-65, the years 1960-2007, or the temperatures 30F – 80F for use in your simulation (everyone runs simulations, right?). No matter your range, you can start with the “0 to 1″ building block and modify it.
Sure, you can figure this out without a diagram, but sometimes it’s nice to visualize what’s happening. Our brain is a vision-processing supercomputer, so let’s use its strengths.
What’s next?
This post introduces the idea that arithmetic is a transformation. You bend numbers into other ones, and each transformation has a meaning. Some fit a situation better than others: use the one you like most.
The goal isn’t to turn multiplication into a cumbersome diagramming process. It’s a technique, a mindset, a new weapon to use against seemingly complex operations.
When studying linear algebra (matrices), you can view multiplication as a type of transformation (scaling, rotating, skewing), instead of a bunch of operations that change a matrix around. This approach will help when we cover imaginary numbers, that foul beast which has befuddled many students.
Little insights help bigger ideas click. Happy math.


Leave a Reply
55 Comments on "Rethinking Arithmetic: A Visual Guide"
The vector addition example for simple addition isn’t the best, IMHO, because to really add vectors like that you have to use squares and square roots. It would be probably better to just add scalar quantities.
Moreover, since you use blocks you can’t just add vectors because to walk blocks you use Manhattan distance and not cartesian distance, so 3 + 4 blocks is actually 7, and not 5.
Hi eliben, thanks for the comment. Yeah, the goal of the vector example wasn’t the distance metric, more the idea that you need to keep track of the parts that went in.
When adding apples, you have “3 + 4 = 7” and don’t really care that it was 3 and 4 before (2 + 5 gives the same result). With vectors, you get (3,4) and need to track each dimension separately (2 and 5 are very different). I’ll see if I can make this more clear.
Since this is a visual guide, I have a comment on the illustrations.
In the negative/inverse diagrams, the labels (x-2 and x1/2) are rather confusing. I originally interpreted “x-2” as “some quantity, X, minus two” rather than “multiply by negative two.” This is partly due to the spacing between characters, but it’s mostly caused by the ambiguity in the meaning of “x”, particularly when combined with “-“. The “scale by -3” diagram also has this problem, but I understood the correct meaning much faster because I had already figured out the previous diagram.
Hi Barb, thanks for the comment! Finding and fixing parts that aren’t clear is one of the great things about a blog.
I redrew the diagrams to use terms like “3x”, which I think is a more natural way to say “3 times” (on camera zooms, etc.). Hope this helps.
I’m a programmer – well, actually more of a ‘scripter’. I don’t recall how I originally ran across your site, but I’ve really been enjoying each post. I don’t deal with math on a level most others viewing this blog probably do – but I really enjoy the thought-provoking nature of the content you provide. Keep it up!
I really like the diagrams you use to illustrate your points, what are you using to generate these? I’d love to know so that I may do similar things in my own posts.
Thanks
good post!!! I think what I got out of it the most was the idea of ‘context’. Having high school kids, it is easy to fall into the ‘plug and chug’ syndrome. thanks again “Professor Azad”
@Jed: Thanks for the note, glad you’ve found the site helpful. I try to do about 1 brain-bending post a week but hope the depth balances the frequency. I’ll keep cranking :).
I use PowerPoint 2007 to make the diagrams. The world needs more visuals, I’m happy to hear you’ll be adding to them!
@T: Thanks Mr. Rose! Yes, I find context is one of those “assumptions” that’s made but it’s nice to state explicitly.
I often wonder whether it’s better to teach plug-and-chug first to get the basics, then layer in understanding, and revisit plug-and-chug. Often times though, math teachers don’t get past the plug-and-chug step and go onto the next topic :). Glad you liked it.
I like your visualization of the Random Numbers example, although I think my brain would prefer to slide first and scale afterwards, because it’s a lot easier for me to visualize moving to the start point first and then stretching towards the end point. (Also, it’s easier to carry a small 1 rather than a big, scaled 5 that far! Hehe.)
Hi Travholt, thanks for the comment! Yes, sliding then stretching is possible but has a few subtleties:
Step 1: Slide over 5, so you have r + 5 [the random number range is 5-6].
Step 2: Now we want to stretch our current endpoint (6) to the max of 10. Basically, we want to tack on another “random” range 0-4 to the end. 0-4 is really 4r.
Step 3: Add it together: (r + 5) + 4r. This is the same as 5r + 5, just stated differently.
This gives the same result, but is a different way of thinking about it.
The problem with raw scaling is that it moves the left side as well as the right. So it works best when your left side is at zero.
That’s a great point though, I may extend the example above to include this also.
I like the way you use graphics to explain concepts. Very good post Kalid.
Keep them coming!
Thanks — I’ll keep cranking them out :).
Hm, I think I’m not communicating my point very well. Let me try again. The only thing I was trying to say was how my mind would attack this problem.
“I need to pick a random year between 5 and 10. So I’ll start with 5 and add a random number.”
5 + r
“My random number generator produces a number between 0 and 1, and my desired interval is 10 – 5 = 5, so I’ll multiply the random number by 5.”
5 + r * 5
So I end up with the same formula as you did (and not (r+5)+4r), but with the addends reversed, because this fits better with how my brain attacks the problem.
[…] Using visual diagrams, not just text, to understand the idea. […]
Nice Job Khalid. Started to read about Permutations – Ended reading for more than 3 hours. All articles are nicely put.
BTW what program do you use for drawing your images?
@Travholt: Thanks for the clarification, I think I overcomplicated it! (That’s 3 different ways to think about it). Sliding to 5 and then “tacking on” a random number from 0-5 works also. It’s fun seeing how different people approach the same problem.
@Ashok: Thanks, glad you found it useful! I use PowerPoint 2007 to make the diagrams.
[…] We’ve seen that regular addition can be thought of as “sliding” by a number. Addition with complex numbers is similar, but we can slide in two dimensions (real or imaginary). For example: […]
[…] Rethinking Arithmetic: A Visual Guide | BetterExplained (tags: toread math learning programming reference visual guide ** mathematics) […]
[…] Scale or stretch a number […]
[…] To most of us, it’s “the number in the middle” or a number that is “balanced”. I’m a fan of taking multiple viewpoints, so here’s another interpretation of the average: […]
Wouldn’t it make more sense to use lines than blocks? A block would be a number with a width value a height value, and a starting coordinate (x and y values minimum) to have four values in all. A line only has two values, being a starting coordinate (only x minimum) and a magnitude. A point itself is a value (or equal to multiplying times 1 or adding by 0). Your random number would be a line also, but one that acts differently than a transformation line in that you can transform to either the magnitude of the random number or the location of the random number.
[…] Rethinking Arithmetic: A Visual Guide | BetterExplained […]
[…] Arithmetic became a way to transform a number: Addition was sliding (+3 means slide 3 units to the right), and multiplication was scaling (times 3 means scale it up 3x). […]
Here’s a fighting aspect to it: throwing a combination of punches like 1-2-3 is really repeating a natural rhythm of punches, which gives the opponent three times the rhythm information and three times the chances of counterattack. Using this as a starting point can help explain why there is a point of diminishing returns for the effectiveness of long combinations, aside from just the muscle deterioration or energy reserve depletion theories. (mostly, because this holds true in video games as well, even video games that ignore fatigue!)
[…] Numbers: number systems, visual arithmetic, different bases, Prime numbers […]
[…] Rethinking Arithmetic: A Visual Guide (tags: mathematics visualization reference education) […]