Let's practice our abstraction skills by simplifying concepts in Calculus.
Last time, we saw how abstraction simplifies ideas.

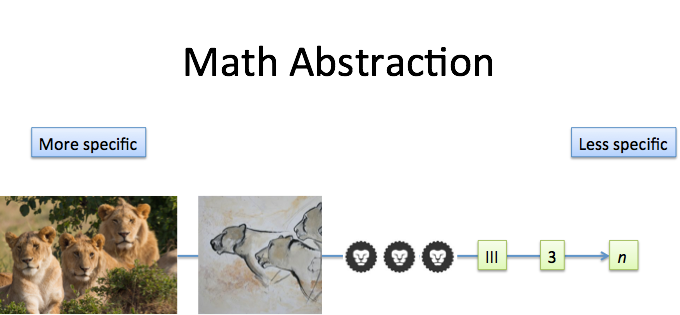
After removing enough detail, a photo of lions turns into the notion of quantity (where n happens to be 3 in this case).
Let's apply this to a function like $f(x) = x^2$. What's the simplified essence?
Here were my first thoughts as I worked through the idea:

Abstraction 1: Multiple shapes
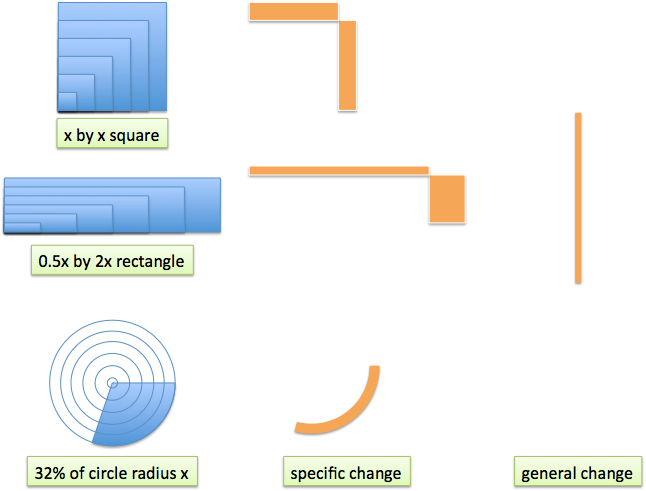
First, look at a few representations of $x^2$. The common cliche is that it represents a square of side x, but we can be more creative. What about a rectangle with sides $\frac{1}{2}x$ and $2x$? How about a portion of a circle? (If $\text{area} = \pi r^2$ then $\frac{1}{\pi}$ (32%) should leave us with $r^2$.)
Abstraction 2: Examine the specific changes
Next, look at the changes that happen with each of our shapes. The square gets equal lengths added to each side. The rectangle gets a "long, skinny" and "short, fat" added to each side. (The corners can be ignored for now.)
The changes to the circle are the simplest, with a small arc being added.
Abstraction 3: Make the changes general
Like the lion scenario above, we have a unique representation of each change ("three lion icons"). Let's make the changes generic (three lines) by finding a common format.
Here, we "melt down" each change until it resembles a straight line. Because the square, rectangle, and circle all represent $x^2$, the same line can describe the changes they undergo. Neat!
Now that's some nice abstractin', let's keep it going:

Abstraction 4: Separate the line
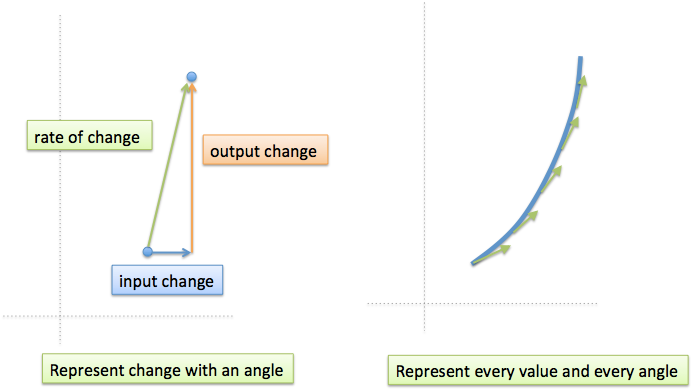
The orange "change line" is actually a transition between a starting and ending position. If we represent the start and end as blue dots, the height of the line is the amount of change between them.
Notice how we make an angled line as well: the input change (blue line) and output change (orange line) trace out the rate of change (green line).
Abstraction 5: Show every state and angle
Rather than picking specific starting and endpoint positions, graph every position (blue curve) and every rate of change (green line at each point).
The blue curve actually generates the green line: at any point, we can draw the tangent line and see the "change angle" to the next neighbor.
The Number/Angle Abstraction
Here's where I get excited. On a graph, we're used to literal representations: we need a bigger line to represent a bigger change. But an angle (a certain ratio of height:width) represents every number in the same amount of space!

0:1 is 0 degrees
1:1 is 45 degrees
2:1 is 63.4 degrees ($\arctan(2) = 63.4$)
100:1 is 89.4 degrees ($\arctan(100) = 89.4$)
By using an angle, we've curled the number line into a format that fits into any space. Even a giant number like 10,000,000,000 can be written with the same effort as "1". Must bigger numbers take up more room?
We have a clean abstraction: The curve shows every possible scenario, and the angle quantifies the rate of change. In a way, the curve "writes down" its rate of change at every point.
Yowza. Maybe we discussed this in class, but I didn't think of it this way until trying to abstract each step.
This was a peek into an organic "aha-finding" technique: start with a specific idea, keep generalizing, and see what insights emerge.
Happy math.
Other Posts In This Series
- A Gentle Introduction To Learning Calculus
- Understanding Calculus With A Bank Account Metaphor
- Prehistoric Calculus: Discovering Pi
- A Calculus Analogy: Integrals as Multiplication
- Calculus: Building Intuition for the Derivative
- How To Understand Derivatives: The Product, Power & Chain Rules
- How To Understand Derivatives: The Quotient Rule, Exponents, and Logarithms
- An Intuitive Introduction To Limits
- Intuition for Taylor Series (DNA Analogy)
- Why Do We Need Limits and Infinitesimals?
- Learning Calculus: Overcoming Our Artificial Need for Precision
- A Friendly Chat About Whether 0.999... = 1
- Analogy: The Calculus Camera
- Abstraction Practice: Calculus Graphs
- Quick Insight: Easier Arithmetic With Calculus
- How to Add 1 through 100 using Calculus
- Integral of Sin(x): Geometric Intuition