A  Guide To Calculus
2. Practice Your X-Ray and Time-Lapse Vision
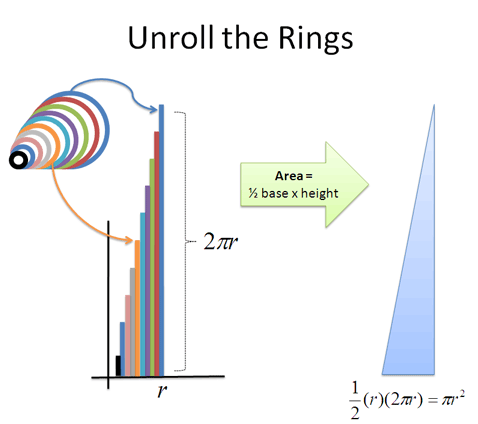
Calculus trains us to use X-Ray and Time-Lapse vision, such as re-arranging a circle into a "ring triangle" (diagram). This makes finding the area… well, if not exactly easy, much more manageable.
But we were a little presumptuous. Must every circle in the universe be made from rings?
Heck no! We're more creative than that. Here's a few more options for our X-Ray:
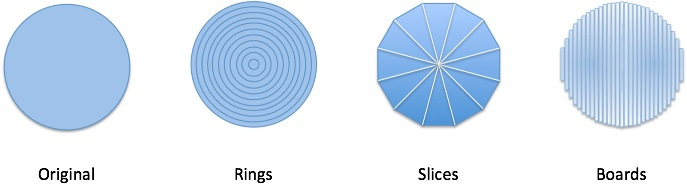
Now we're talking. We can imagine a circle as a set of rings, pizza slices, or vertical boards. Each underlying "blueprint" is a different step-by-step strategy in action.
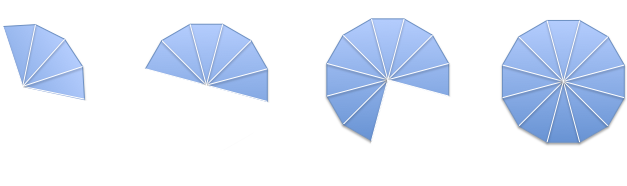
Imagine each strategy unfolding over time, using your time-lapse vision. Have any ideas about what each approach is good for?
Ring-by-ring Analysis

Rings are the old standby. What's neat about a ring-by-ring progression?
-
Each intermediate stage is an entire "mini circle" on its own. i.e., when we're halfway done, we still have a circle, just one with half the regular radius.
-
Each step is an increasing amount of work. Just imagine plowing a circular field and spreading the work over several days. On the first day, you start at the center and don't even move. The next, you make take the tightest turn you can. Then you start doing laps, larger and larger, until you are circling the entire yard on the last day. (Note: The change between each ring is the same; maybe it's 1 extra minute each time you make the ring larger).
-
The work is reasonably predictable, which may help planning. If we know it's an extra minute for each lap, then the 20th ring will take 20 minutes.
-
Most of the work happens in the final laps. In the first 25% of the timelapse, we've barely grown: we're adding tiny rings. Near the end, we start to pick up steam by adding long slices, each nearly the final size.
Now let's get practical: why is it that trees have a ring pattern inside?
It's the first property: a big tree must grow from a complete smaller tree. With the ring-by-ring strategy, we're always adding to a complete, fully-formed circle. We aren't trying to grow the "left half" of the tree and then work on the right side.
In fact, many natural processes that grow (trees, bones, bubbles, etc.) take this inside-out approach.
Slice-by-slice Analysis
Now think about a slice-by-slice progression. What do you notice?
-
We contribute the same amount with each step. Even better, the parts are identical. This may not matter for math, but in the real world (aka cutting a cake), we make the same action when cutting out each slice, which is convenient.
-
Since the slices are symmetrical, we can use shortcuts like making cuts across the entire shape to speed up the process. These "assembly line" speedups work well for identical components.
-
Progress is extremely easy to measure. If we have 10 slices, then at slice 6 we are exactly 60% done (by both area and circumference).
-
We follow a sweeping circular path, never retracing our steps from an "angular" point of view. When carving out the rings, we went through the full 360-degrees on each step.
Time to think about the real world. What follows this slice-by-slice pattern, and why?
Well food, for one. Cake, pizza, pie: we want everyone to have an equal share. Slices are simple to cut, we get nice speedups (like cutting across the cake), and it's easy to see how much is remaining. (Imagine cutting circular rings from a pie and trying to estimate how much area is left.)
Now think about radar scanners: they sweep out in a circular path, "clearing" a slice of sky before moving to another angle. This strategy does leave a blind spot in the angle you haven't yet covered, a tradeoff you're hopefully aware of.
Contrast this to sonar used by a submarine or bat, which sends a sound "ring" propagating in every direction. That works best for close targets (covering every direction at once). The drawback is that unfocused propagation gets much weaker the further out you go, as the initial energy is spread out over a larger ring. We use megaphones and antennas to focus our signals into beams (thin slices) to get the max range for our energy.
Operationally, if we're building circular shape from a set of slices (like a paper fan), it helps to have every part be identical. Figure out the best way to make a single slice, then mass produce them. Even better: if one slice can collapse, the entire shape can fold up!
Board-by-board Analysis

Getting the hang of X-Rays and Time-lapses? Great. Look at the progression above, and spend a few seconds thinking of the pros and cons. Don't worry, I'll wait.
Ready? Ok. Here's a few of my observations:
-
This is a very robotic pattern, moving left-to-right and never returning to a previous horizontal position.
-
The contribution from each step starts small, gradually gets larger, maxes out in the middle, and begins shrinking again.
-
Our progress is somewhat unpredictable. Sure, at the halfway mark we've finished half the circle, but the pattern rises and falls which makes it difficult to analyze. By contrast, the ring-by-ring pattern changed the same amount each time, always increasing. It was clear that the later rings would add the most work. Here, it's the middle section which seems to be doing the heavy lifting.
Ok, time to figure out where this pattern shows up in the real world.
Decks and wooden structures, for one. When putting down wooden planks, we don't want to retrace our steps, or return to a previous position (especially if there are other steps involved, like painting). Just like a tree needs a fully-formed circle at each step, a deck insists upon components found at Home Depot (i.e., rectangular boards).
In fact, any process with a linear "pipeline" might use this approach: finish a section and move onto the next. Think about a printer that has to spray a pattern top-to-bottom as the paper is fed through (or these days, a 3d printer). It doesn't have the luxury of a ring-by-ring or a slice-by-slice approach. It will see a horizontal position only once, so it better make it count!
From a human motivation perspective, it may be convenient to start small, work your way up, then ease back down. A pizza-slice approach could be tolerable (identical progress every day), but rings could be demoralizing: every step requires more than the one before, without yielding.
Getting Organized
So far, we've been using natural descriptions to explain our thought processing. "Take a bunch of rings" or "Cut the circle into pizza slices". This conveys a general notion, but it's a bit like describing a song as "Dum-de-dum-dum" -- you're pretty much the only one who knows what's happening. A little organization can make it perfectly clear what we mean.
The first thing we can do is keep track of how we're making our steps. I like to imagine a little arrow in the direction we move as we take slices:
![]()
In my head, I'm moving along the yellow line, calling out the steps like Oprah giving away cars (you get a ring, you get a ring, you get a ring…). (Hey, it's my analogy, don't give me that look!)
The arrow is handy, but it's still tricky to see the exact progression of slices. Why don't we explicitly "line up" the changes? As we saw before, we can unroll the steps, put them side-by-side, and make them easier to compare:

The black arrow shows the trend. Pretty nice, right? We can tell, at a glance, that the slices are increasing, and by the same amount each time (since the trend line is straight).
Math fans and neurotics alike enjoy these organized layouts; there is something soothing about it, I suppose. And since you're here, we might as well organize the other patterns too:
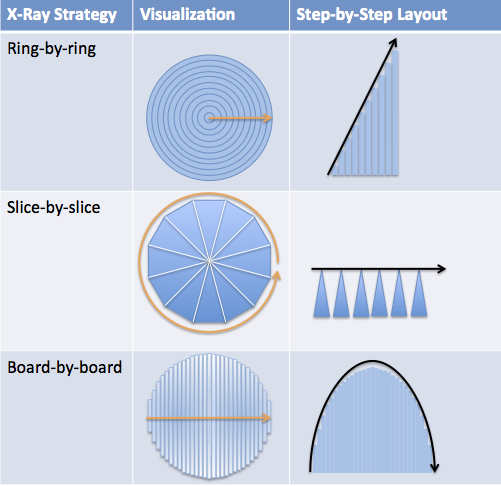
Now it's much easier to compare each X-Ray strategy:
- With rings, steps increase steadily (upward sloping line)
- With slices, steps stay the same (flat line)
- With boards, steps get larger, peak, then get smaller (up and down; note, the curve looks elongated because the individual boards are lined up on the bottom)
The charts made our comparisons easier, wouldn't you say? Sure. But wait, isn't that trendline looking like a dreaded x-y graph?
Yep. Remember, a graph is a visual explanation that should help us. If it's confusing, it needs to be fixed.
Many classes present graphs, divorced from the phenomena that made them, and hope you see an invisible sequence of steps buried inside. It's a recipe for pain -- just be explicit about what a graph represents!
Archimedes did fine without x-y graphs, finding the area of a circle using the "ring-to-triangle" method. In this primer we'll leave our level of graphing to what you see above (the details of graphs will be a nice follow-up, after our intuition is built).
So, are things starting to click a bit? Thinking better with X-Rays and Time-lapses?
PS. It may bother you that our steps create a "circle-like" shape, but not a real, smooth circle. We'll get to that :). But to be fair, it must also bother you that the square pixels on this screen make "letter-like" shapes, and not real, smooth letters. And somehow, the "letter-like pixels" convey the same meaning as the real thing!
Questions
1) What's your grandma-friendly version of what you've learned?
2) Let's expand our thinking into the 3rd dimension. Can you of a few ways to build a sphere? (No formulas, just descriptions)
3) What clicked? Any questions?
I'll share a few approaches with you in the next lesson. Happy math.