An Interactive Guide To The Fourier Transform

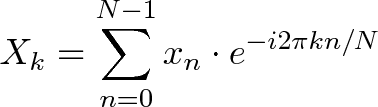
The Fourier Transform is one of deepest insights ever made. Unfortunately, the meaning is buried within dense equations:

\displaystyle{X_k = \sum_{n=0}^{N-1} x_n \cdot e^{-i 2 \pi k n / N}}

\displaystyle{x_n = \frac{1}{N} \sum_{k=0}^{N-1} X_k \cdot e^{i 2 \pi k n / N}}

Yikes. Rather than deciphering it symbol-by-symbol, let's experience the idea. Here's a plain-English metaphor:

  • What does the Fourier Transform do? Given a smoothie, it finds the recipe.
  • How? Run the smoothie through filters to extract each ingredient.
  • Why? Recipes are easier to analyze, compare, and modify than the smoothie itself.
  • How do we get the smoothie back? Blend the ingredients.

Next, we'll refine the analogy into "math-English":

  • The Fourier Transform extracts each "cycle ingredient" from a time-based signal (the cycle strength, delay & speed), resulting in a final "cycle recipe"

Time for the equations? No! Let's get our hands dirty and experience cycles making patterns with live simulations.

If all goes well, we'll have an aha! moment and intuitively realize why the Fourier Transform is possible. We'll save the detailed math analysis for the follow-up.

This isn't a force-march through the equations, it's the casual stroll I wish I had. Onward!

From Smoothie to Recipe

A math transformation is a change of perspective. We change our notion of quantity from "single items" (lines in the sand, tally system) to "groups of 10" (decimal) depending on what we're counting. Scoring a game? Tally it up. Multiplying? Decimals, please.

The Fourier Transform changes our perspective from consumer to producer, turning "What did I see" into "How was it made?".

In other words: given a smoothie, let's find the recipe.

Why? Well, recipes are great descriptions of drinks. You wouldn't share a drop-by-drop analysis, you'd say "I had an orange/banana smoothie". A recipe is more easily categorized, compared, and modified than the object itself.

So... given a smoothie, how do we find the recipe?

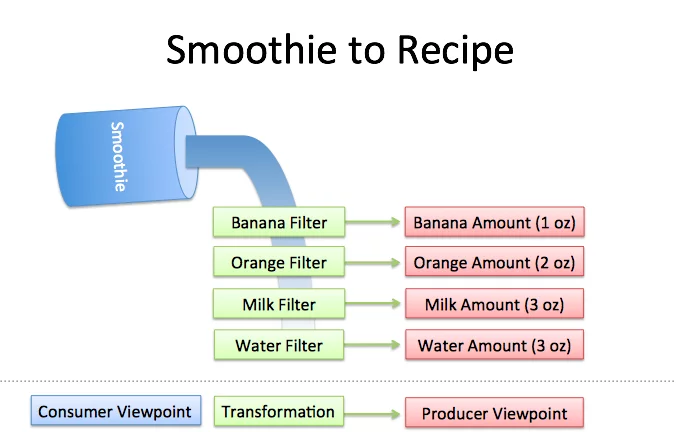
Well, imagine you had a few filters lying around:

  • Pour through the "banana" filter. 1 oz of bananas are extracted.
  • Pour through the "orange" filter. 2 oz of oranges.
  • Pour through the "milk" filter. 3 oz of milk.
  • Pour through the "water" filter. 3 oz of water.

We can reverse-engineer the recipe by filtering each ingredient. The catch?

  • Filters must be independent. The banana filter needs to capture bananas, and nothing else. Adding more oranges should never affect the banana reading.

  • Filters must be complete. We won't get the real recipe if we leave out a filter ("There were mangoes too!"). Our collection of filters must catch every last ingredient.

  • Ingredients must be combine-able. Smoothies can be separated and re-combined without issue (A cookie? Not so much. Who wants crumbs?). The ingredients, when separated and combined in any order, must behave the same (linearly).

Seeing The World As Cycles

The Fourier Transform takes a specific viewpoint: What if any signal could be made from circular motion (repeating cycles)?

Whoa. This concept is mind-blowing, and poor Joseph Fourier had his idea rejected at first. (Really Joe, even a staircase pattern can be made from circles?)

And despite decades of debate in the math community, we expect students to internalize the idea without issue. Ugh. Let's walk through the intution.

The Fourier Transform finds the recipe for a signal, like our smoothie process:

  • Start with a time-based signal
  • Apply filters to measure each possible "circular ingredient"
  • Collect the full recipe, listing the amount of each "circular ingredient"

Stop. Here's where most tutorials excitedly throw engineering applications at your face. Don't get scared; think of the examples as "Wow, we're finally seeing the source code (DNA) behind previously confusing ideas".

  • If earthquake vibrations can be separated into "ingredients" (vibrations of different speeds & strengths), buildings can be designed to avoid interacting with the strongest ones.

  • If sound waves can be separated into ingredients (bass and treble frequencies), we can boost the parts we care about, and hide the ones we don't. The crackle of random noise can be removed. Maybe similar "sound recipes" can be compared (music recognition services compare recipes, not the raw audio clips).

  • If computer data can be represented with oscillating patterns, perhaps the least-important ones can be ignored. This "lossy compression" can drastically shrink file sizes (and why JPEG and MP3 files are much smaller than raw .bmp or .wav files).

  • If a radio wave is our signal, we can use filters to listen to a particular channel. In the smoothie world, imagine each person paid attention to a different ingredient: Adam looks for apples, Bob looks for bananas, and Charlier gets cauliflower (sorry bud).

The Fourier Transform is useful in engineering, sure, but it's a metaphor about finding the root causes behind an observed effect.

Think With Circles, Not Just Sinusoids

One of my giant confusions was separating the definitions of "sinusoid" and "circle".

  • A "sinusoid" is a specific back-and-forth pattern (a sine or cosine wave), and 99% of the time, it refers to motion in one dimension
  • A "circle" is a round, 2d pattern you probably know. If you enjoy using 10-dollar words to describe 10-cent ideas, you might call a circular path a "complex sinusoid".

Labeling a circular path as a "complex sinusoid" is like describing a word as a "multi-letter". You zoomed into the wrong level of detail. Words are about concepts, not the letters they can be split into!

The Fourier Transform is about circular paths (not 1-d sinusoids) and Euler's formula is a clever way to generate one:

euler path

Must we use imaginary exponents to move in a circle? Nope. But it's convenient and compact. We can separate the path into real and imaginary parts, but don't forget the big picture: we move in circles.

Following Circular Paths

Let's say we're chatting on the phone and, like usual, I want us to draw the same circular path simultaneously (You promised!). What should I say?

  • How big is the circle? (Amplitude, i.e. size of radius)
  • How fast do we draw it? (Frequency. 1 circle/second is a frequency of 1 Hertz (Hz) or 2*pi radians/sec)
  • Where do we start? (Phase angle, where 0 degrees is the x-axis)

I could say "2-inch radius, start at 45 degrees, 1 circle per second, go!". After half a second we should be at the same spot: starting point + amount traveled = 45 + 180 = 225 degrees (on a 2-inch circle).

Every circular path needs a size, speed, and starting angle (amplitude/frequency/phase). We can even combine paths: imagine tiny motorcars, driving in circles at different speeds.

The combined position of all the cycles is our signal, just like the combined flavor of all the ingredients is our smoothie.

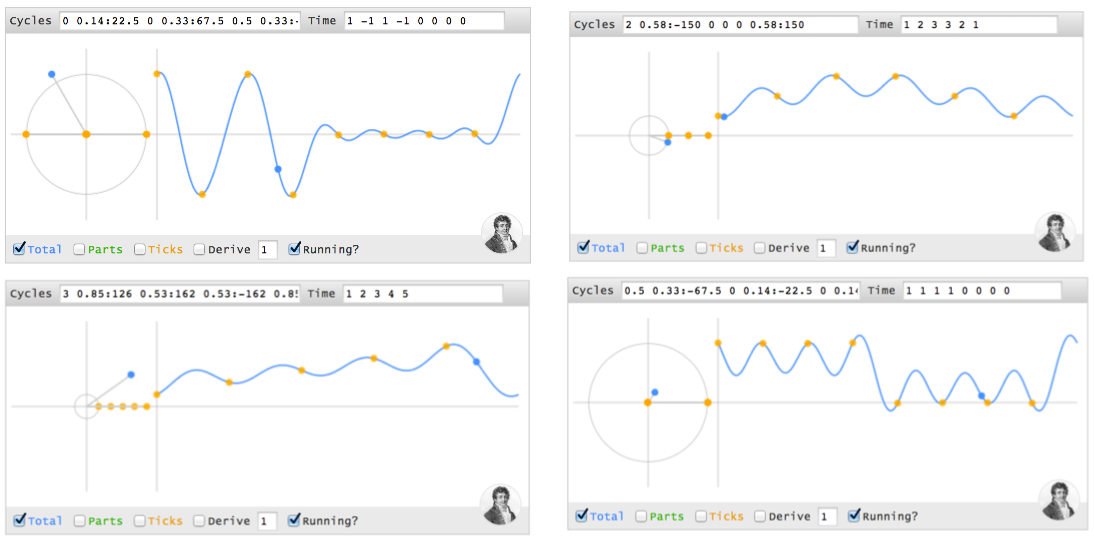
Here's a simulation of a basic circular path:

(Layout and initial code based on this animation. Modern browser required. Click the graph to pause/unpause.)

The magnitude of each cycle is listed in order, starting at 0Hz. Cycles [0 1] means

  • 0 strength for the 0Hz cycle (0Hz = a constant cycle, stuck on the x-axis at zero degrees)
  • 1 strength for the 1Hz cycle (completes 1 cycle per time interval)

Now the tricky part:

  • The blue graph measures the real part of the cycle. Another lovely math confusion: the real axis of the circle, which is usually horizontal, has its magnitude shown on the vertical axis. You can mentally rotate the circle 90 degrees if you like.
  • The time points are spaced at the fastest frequency. A 1Hz signal needs 2 time points for a start and stop (a single data point doesn't have a frequency). The time values [1 -1] shows the amplitude at these equally-spaced intervals.

With me? [0 1] is a pure 1Hz cycle.

Now let's add a 2Hz cycle to the mix. [0 1 1] means "Nothing at 0Hz, 1Hz of strength 1, 2Hz of strength 1":

Whoa. The little motorcars are getting wild: the green lines are the 1Hz and 2Hz cycles, and the blue line is the combined result. Try toggling the green checkbox to see the final result clearly. The combined "flavor" is a sway that starts at the max and dips low for the rest of the interval.

The yellow dots are when we actually measure the signal. With 3 cycles defined (0Hz, 1Hz, 2Hz), each dot is 1/3 of the way through the signal. In this case, cycles [0 1 1] generate the time values [2 -1 -1], which starts at the max (2) and dips low (-1).

Oh! We can't forget phase, the starting angle! Use magnitude:angle to set the phase. So [0 1:45] is 1Hz cycle that starts at 45 degrees:

This is a shifted version of [0 1]. On the time side we get [.7 -.7] instead of [1 -1], because our cycle isn't exactly lined up with our measuring intervals, which are still at the halfway point (this could be desired!).

The Fourier Transform finds the set of cycle speeds, strengths and phases to match any time signal.

Our signal becomes an abstract notion that we consider as "observations in the time domain" or "ingredients in the frequency domain".

Enough talk: try it out! In the simulator, type any time or cycle pattern you'd like to see. If it's time points, you'll get a collection of cycles (that combine into a "wave") that matches your desired points.

But… doesn't the combined wave have strange values between the yellow time intervals? Sure. But who's to say whether a signal travels in straight lines, or curves, or zips into other dimensions when we aren't measuring it? It behaves exactly as we need at the equally-spaced moments we asked for.

Making A Spike In Time

Can we make a spike in time, like (4 0 0 0), using cycles? (I'll use parens for time points)

Although the spike seems boring to us time-dwellers (that's it?), think about the complexity in the cycle world. Our cycle ingredients must start aligned (at the max value, 4) and then "explode outwards", each cycle with partners that cancel it in the future. Every remaining point is zero, which is a tricky balance with multiple cycles running around (we can't just "turn them off").

Let's walk through each time point:

  • At time 0, the first instant, every cycle ingredient is at its max. Ignoring the other time points, (4 ? ? ?) can be made from 4 cycles (0Hz 1Hz 2Hz 3Hz), each with a magnitude of 1 and phase of 0 (i.e., 1 + 1 + 1 + 1 = 4).

  • At every future point (t = 1, 2, 3), the sum of all cycles must cancel.

Here's the trick: when two cycles are on opposites sides of the circle (North & South, East & West, etc.) their combined position is zero (3 cycles can cancel if they're spread evenly at 0, 120, and 240 degrees).

Imagine a constellation of points moving around the circle. Here's the position of each cycle at every instant:

Time 0 1 2 3 
------------
0Hz: 0 0 0 0 
1Hz: 0 1 2 3
2Hz: 0 2 0 2
3Hz: 0 3 2 1

Notice how the the 3Hz cycle starts at 0, gets to position 3, then position "6" (with only 4 positions, 6 modulo 4 = 2), then position "9" (9 modulo 4 = 1).

When our cycle is 4 units long, cycle speeds a half-cycle apart (2 units) will either be lined up (difference of 0, 4, 8…) or on opposite sides (difference of 2, 6, 10…).

OK. Let's drill into each time point:

  • Time 0: All cycles at their max (total of 4)
  • Time 1: 1Hz and 3Hz cancel (positions 1 & 3 are opposites), 0Hz and 2Hz cancel as well. The net is 0.
  • Time 2: 0Hz and 2Hz line up at position 0, while 1Hz and 3Hz line up at position 2 (the opposite side). The total is still 0.
  • Time 3: 0Hz and 2Hz cancel. 1Hz znd 3Hz cancel.
  • Time 4 (repeat of t=0): All cycles line up.

The trick is having individual speeds cancel (0Hz vs 2Hz, 1Hz vs 3Hz), or having the lined-up pairs cancel (0Hz + 2Hz vs 1Hz + 3Hz).

When every cycle has equal power and 0 phase, we start aligned and cancel afterwards. (I don't have a nice proof yet -- any takers? -- but you can see it yourself. Try [1 1], [1 1 1], [1 1 1 1] and notice the time spikes: (2 0), (3 0 0), (4 0 0 0)).

Here's how I visualize the initial alignment, followed by a net cancellation:

Moving The Time Spike

Not everything happens at t=0. Can we change our spike to (0 4 0 0)?

It seems the cycle ingredients should be similar to (4 0 0 0), but the cycles must align at t=1 (one second in the future). Here's where phase comes in.

Imagine a race with 4 runners. Normal races have everyone lined up at the starting line, the (4 0 0 0) time pattern. Boring.

What if we want everyone to finish at the same time? Easy. Just move people forward or backwards by the appropriate distance. Maybe granny can start 2 feet in front of the finish line, Usain Bolt can start 100m back, and they can cross the tape holding hands.

Phase shifts, the starting angle, are delays in the cycle universe. Here's how we adjust the starting position to delay every cycle 1 second:

  • A 0Hz cycle doesn't move, so it's already aligned
  • A 1Hz cycle goes 1 revolution in the entire 4 seconds, so a 1-second delay is a quarter-turn. Phase shift it 90 degrees backwards (-90) and it gets to phase=0, the max value, at t=1.
  • A 2Hz cycle is twice as fast, so give it twice the angle to cover (-180 or 180 phase shift -- it's across the circle, either way).
  • A 3Hz cycle is 3x as fast, so give it 3x the distance to move (-270 or +90 phase shift)

If time points (4 0 0 0) are made from cycles [1 1 1 1], then time points (0 4 0 0) are made from [1 1:-90 1:180 1:90]. (Note: I'm using "1Hz", but I mean "1 cycle over the entire time period").

Whoa -- we're working out the cycles in our head!

The interference visualization is similar, except the alignment is at t=1.

Test your intuition: Can you make (0 0 4 0), i.e. a 2-second delay? 0Hz has no phase. 1Hz has 180 degrees, 2Hz has 360 (aka 0), and 3Hz has 540 (aka 180), so it's [1 1:180 1 1:180].

Discovering The Full Transform

The big insight: our signal is just a bunch of time spikes! If we merge the recipes for each time spike, we should get the recipe for the full signal.

The Fourier Transform builds the recipe frequency-by-frequency:

  • Separate the full signal (a b c d) into "time spikes": (a 0 0 0) (0 b 0 0) (0 0 c 0) (0 0 0 d)
  • For any frequency (like 2Hz), the tentative recipe is "a/4 + b/4 + c/4 + d/4" (the strength of each spike is split among all frequencies)
  • Wait! We need to offset each spike with a phase delay (the angle for a "1 second delay" depends on the frequency).
  • Actual recipe for a frequency = a/4 (no offset) + b/4 (1 second offset) + c/4 (2 second offset) + d/4 (3 second offset).

We can then loop through every frequency to get the full transform.

Here's the conversion from "math English" to full math:

A few notes:

  • N = number of time samples we have
  • n = current sample we're considering (0 .. N-1)
  • xn = value of the signal at time n
  • k = current frequency we're considering (0 Hertz up to N-1 Hertz)
  • Xk = amount of frequency k in the signal (amplitude and phase, a complex number)
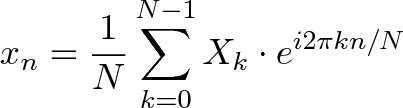
  • The 1/N factor is usually moved to the reverse transform (going from frequencies back to time). This is allowed, though I prefer 1/N in the forward transform since it gives the actual sizes for the time spikes. You can get wild and even use 1/sqrt(N) on both transforms (going forward and back still has the 1/N factor).
  • n/N is the percent of the time we've gone through. 2 * pi * k is our speed in radians / sec. e^-ix is our backwards-moving circular path. The combination is how far we've moved, for this speed and time.
  • The raw equations for the Fourier Transform just say "add the complex numbers". Many programming languages cannot handle complex numbers directly, so you convert everything to rectangular coordinates and add those.

Onward

This was my most challenging article yet. The Fourier Transform has several flavors (discrete/continuous/finite/infinite), covers deep math (Dirac delta functions), and it's easy to get lost in details. I was constantly bumping into the edge of my knowledge.

But there's always simple analogies out there -- I refuse to think otherwise. Whether it's a smoothie or Usain Bolt & Granny crossing the finish line, take a simple understanding and refine it. The analogy is flawed, and that's ok: it's a raft to use, and leave behind once we cross the river.

I realized how feeble my own understanding was when I couldn't work out the transform of (1 0 0 0) in my head. For me, it was like saying I "knew" addition but, gee whiz, I'm not sure what "1 + 1 + 1 + 1" would be. Why not? Shouldn't we have an intuition for the simplest of operations?

That discomfort led me around the web to build my intuition. In addition to the references in the article, I'd like to thank:

Today's goal was to experience the Fourier Transform. We'll save the advanced analysis for next time.

Happy math.

Appendix: Projecting Onto Cycles

Stuart Riffle has a great interpreation of the Fourier Transform:

(With an animation here)

Imagine spinning your signal in a centrifuge and checking for a bias. I have a correction: we must spin backwards (the exponent in the equation above needs a negative sign). You already know why: we need a phase delay so spikes appear in the future.

Appendix: Another Awesome Visualization

Lucas Vieira, author of excellent Wikipedia animations, was inspired to make this interactive animation:

(Detailed list of control options)

The Fourier Transform is about cycles added to cycles added to cycles. Try making a "time spike" by setting a strength of 1 for every component (press Enter after inputting each number). Fun fact: with enough terms, you can draw any shape, even Homer Simpson.

Other Posts In This Series

  1. A Visual, Intuitive Guide to Imaginary Numbers
  2. Intuitive Arithmetic With Complex Numbers
  3. Understanding Why Complex Multiplication Works
  4. An Intuitive Guide To Exponential Functions & e
  5. Demystifying the Natural Logarithm (ln)
  6. Understanding Exponents (Why does 0^0 = 1?)
  7. A Visual Guide to Simple, Compound and Continuous Interest Rates
  8. Using Logarithms in the Real World
  9. How To Measure Any Distance With The Pythagorean Theorem
  10. Surprising Uses of the Pythagorean Theorem
  11. Rescaling the Pythagorean Theorem
  12. Intuitive Guide to Angles, Degrees and Radians
  13. Intuitive Understanding Of Euler's Formula
  14. Intuitive Understanding of Sine Waves
  15. An Interactive Guide To The Fourier Transform (This post)
Enjoying BetterExplained? Also try InstaCalc on the Mac App Store. It's the fast, easy, shareable calculator you'll love using.

Share what worked: Aha moments & FAQ

Let's create a living reference for how best to understand this topic.

106 thoughts on “An Interactive Guide To The Fourier Transform

  1. Hey, great use of animations to explain and edify..

    and I much appreciate your crediting and linking to my HTML5 sine animation.. Kudos!

    Nice article!

    gord.

  2. awesome! if the world does come to an end today, i can at least die having understood the basics of DFT :)

  3. Spectacular article – I’ve always wanted to see it explained in an intuitive way and you’ve finally done it. Congrats on all the hard work.

  4. @gord: Thanks for the note — the pleasure was all mine, your original sine animation was incredible! So concise and effective.

    @sean: Hah, I feel the same!

    @Mike, @matt, @Bo: Thanks, I appreciate it :)

    @josh: Great point. I’d like to do a follow-up going into some of the more advanced math & interpretations. There’s some good overlaps with linear algebra here too.

  5. @Steve: Glad you enjoyed it! I don’t have an article on convolution yet, but it’d be a great follow-up.

    @Marnee: Looks like it didn’t work for you! The key is realizing whether you’re looking at “ingredients” (inputs) or the “cooked meal” (output). The transform lets you switch between the two. Smoothies are nice because there’s just blending/separating, no “cooking” that is difficult to undo.

  6. Hey, man, this is really great. I like to use DFTs for stochastic processes and look at their underlying trend (this is similar to harmonic regression, which is kinda’ cool). Thanks for this!

  7. I learned it as a way to approximate the solution to conductive heat transfer integral math. The length of the series that substitutes for the equation has diminishing changes after only a few members of the series are calculated. when the material constants are only measureable to within 10%, the answer would be good. the integral math would normally be very hard to solve- the series is easy comparatively speaking (accurate to how many places….).
    It was at that time taught for computerized solutions as finite difference method (rather than finite element method). letting the computer grind out the solution to ‘complicated’ math. Not quite Rayleigh’s ‘shooting’ method (superposition methods solved with a first guess on computer-ie natural frequencies of rotating shafts) but at least as effective. Bessel functions ultimately similar- just more obtuse (3rd order nonlinear partial diff eq….) approximations.

  8. Sorry, Fourier transform’s rotted my brain an University, and I accepted a career in Computing and not Electrical and Electronic Engineering :-)

    I know my place.

  9. What a great article – I’ve been playing on and off with Fourier transforms for years… I don’t think I’ve ever seen anyone elucidate on the subject quite as well as this…

  10. @James: Glad you liked it! Thanks for the link, I’ll check it out (I’m planning on doing a more math-focused follow-up, so that’ll come in handy).

    @Francisco: More than welcome, glad you enjoyed it.

    @Rene: Thanks!

    @Yves: No problem :) . Beauty (a clear explanation?) is in the eye of the beholder.

    @Kwazai: Neat stuff! I believe heat transfer was the original use case for the transform. I’m a physics newbie but would like to get into more applications.

    @NeilPost: The Fourier Transform was a brutal mistress for most of us ;) .

    @Dan: Thanks, really glad it’s helping!

    @Peter: D’oh! Of course there’d be a typo in the first line. Fixed now.

    @Zaine: Awesome. If there are any parts that are confusing after the 2nd reading, I probably need to reword them :) .

  11. do not share those secrets.
    if you know the shortcut maths – hide it. use it for your own profit.
    it’s the only power you have. if you share it to everyine – you will lose your advantage. they won’t pay you back, won’t share their secrets.
    does bankeers share the shortcut maths for integral sums? no. they just convert it into caviar and gold. leaving others complex as hell ineffective school methods.

  12. @Glukk-

    the only way I know to ‘abort’ the system as we know it (prostitutes like bankers…) is to give it away. Best things in life are not free-they just make you happy to think they are.
    Engineering is the art(science?) of fudge factors…
    Mother Earth News solved the global energy crisis in the 70′s- nobody listened….

  13. Kalid, your article appeared in my mailbox and I had no intention of reading it at that moment, but read the first bit and I was totally, totally hooked! I was flat out excellent and we all certainly appreciate the seriously hard work and thought that you obviously put into this. It was riveting, and helped me understand in a much different and wholly more satisfying way, than my college math days, The Fourier Transform. Full marks, Kalid! Full marks!

  14. @Glukk: The Fourier Transform cannot stay in the hands of the math elite!

    @Garth: Awesome, I love it when math gets addictive! Thanks for the kind words :)

    @Gary: Thanks! I’ll have to check that out. I’m looking to do a more math-focused follow-up.

  15. You ask how to easily prove “When every cycle has equal power and 0 phase, we start aligned and cancel afterwards.”

    This is because the roots of x^n = 1 sum to 0 (Vieta’s formulas):
    x^n – 1 = (x-r1)(x-r2)…(x-rn) = x^n – (r1 + r2 + … + rn)x^(n-1) + …
    so r1 + r2 + … + rn = 0.

  16. I think the best way to intuit why a spike can be built in the way you describe is by going back to the circle. I am going to speak extremely loosely in the spirit of your blog.

    Instead of thinking of a sum of sines, let’s go back to your circle analogy. Imagine N evenly spaced “slots” around the circle, in which we can place some number of “dots” which represent the presence of a frequency. As you said, at time 1, the dots will be all evently spaced out throughout the circle, spaced by 1 unit representing each frequency increment. Then at time 2 they will be spaced out by 2, at time 3, 3, etc. However, very often the dots will “wrap around”. In fact, this will always happen unless the dots are placed with a one unit spacing (N slots, N dots, so either you go in steps of one or you have to loop around). What I want to convince you of now is that whether or not there is looping, the resulting occupied slots form a regular polygon on the unit circle, and further, every occupied slot is occupied equally with dots. If the “step size” is not “divisible” into N, then you will hit every slot exactly once. This is an N-sided regular polygon, each slot gets hit the same number of times. (Good!) When there is “divisibility”, this means that you will eventually hit a space you already occupied, and therefore will begin repeating. We are left with a regular polygon, and it also must have each vertex occupied evenly, since repetition happens after a number of times divisible into N. So the result is always expressible as the sum of the vertices of a regular polygon (times some integer to account for some integer number of layers). But it is visually obvious that the sum of vertices of a regular polygon sum to the center of the polygon (zero).

    There is one exception to this rule: a “one-gon” is the only shape with a “bias”. This is what will be responsible for our “spike”. Actually, it’s not surprising that there is a weird exception somewhere, after all, if there were destructive interference everythere, then we woud have found a nontrivial sum of sines that add to zero, proving they are not linearly independent!

    Everything I’ve said above is very loose, but I think the purpose of this blog is not to prove things rigorously, but to get a really good intuition for them. And I hope this is what I have done.

  17. Keep it coming! Thanks!

    It must have been hard work. And fun in putting in a lot of imagination to get this done. Great work.

  18. “One of my giant confusions was separating circles from sinusoids.”
    This was one of my most notable Aha!-moments during the Analysis class as well. Glad to see it explained clearly here. You might find the website below very interesting, especially ‘phasor phactory’ (in case you haven’t encountered it yet).
    http://www.jhu.edu/signals/index.html

    Keep up this useful work,

    M.

  19. This is all very interesting and I do rather like the use of the unit circle definition of the sine wave as an illustrative tool. However, the exposition still lacks something that has always bothered me about discussions of Fourier’s ideas: Specifically, it doesn’t actually explain why the transform works at all. A few years back, when working on a software algorithm for synchronous signal detection, I once again became intrigued by the FFT and why it actually works. At that time, I set upon the task of figuring it out. The result of this effort was an essay, with graphs and mathematics, which I originally called “Fourier for Dummies” – apeing the interminable string of “XXXYouNameIt for Dummies” books.While I left this original title in the link on my web page, I actually named the piece more descriptively as “A look at Fourier from a High School Math Perspective: Fourier and AC Signal Processing”. You can read the essay and/or download a PDF from my web server at:
    http://linuxbio.med.buffalo.edu/Fourier/AC_Signal_Processing.html

    You may hate it or you may love it but it may be worth a look.

  20. A couple examples of using the Fourier integrals and series on a known signal (e.g. a simple one like 1+sin(t)) and showing how the ‘parts’ are extracted would be helpful.

    I tried and failed to get what I expected (e.g. 1 for the DC component for this litle signal above at w=0) when I attempted to evaluate the integral form, which probably just means I forgot how to integrate properly (but Maxima blew up on it too).

    Kalid – As always, thanks *so much* for your efforts! I look forward to you tackling the Laplace transform one of these days:)

  21. 1+sin(t) can be evaluated very easily at w=0 if you remember that e raised to the zero power is always exactly equal to 1. On the otherhand, if you write the integral in expanded form (i.e. as integral of x(t)Cos(wt)-jx(t)Sin(wt)) and integrate piecewise.Then you are only ingtegrating Cos(wt), iSin(wt), Sin(t)Cos(wt) and iSin(t)Sin(wt) and combining the results. Since you have no phase shift and only a single frequency, the integrals of iSin(wt) and Sin(t)Cos(wt) evaluate to exactly zero. The integral of Cos(wt) also evaluates to exactly zero everywhere except at w=0. This is easily seen since Cos(0)=1, so at w=0, you are taking the integral of 1. The integral of iSin(t)Sin(wt) is non-zero when w=1 and zero everywhere else.

    When you actually do the integral, at least for the value of the integral of Cos(0) dt, there is this irritating problem that the integral actually evaluates to “t”, not “1″ and this is probably why Maxima blew up calculating the definite integral: t would have been replaced by infinity in the calculations! This is exactly the problem that Lipot Fejer resolved by proving that the series converged only when cast in terms of the means. So whenever you are attempting to recover amplitudes, you need to take the mean, which essentially means dividing by “t”. When you do this, you get the expected result. You may still need to massage the equations in Maxima to prevent the possibility of dividing Infinity by infinity. Intuitively you (a human) may think that this should be equal to 1, however, in reality it is mathematically undefined This is because infinity+x is still infinity so the ratio of 2 infinities must be indeterminate since, by definition, you can never say that 2 infinities have the same value and there is no way to find out if they do.

    More complex periodic functions can be analyzed in a similar fashion by first applying trigonometric transforms to the functions and then integrating the components. Not always easy, but it works.

  22. Stephen,
    Thanks for replying. I actually did recognize that e^0 is one. The integral becomes integral(1+sin(t)dt), which evaluates to t-cos(t). But, evaluating that from -inf to +inf blows up, which is no big surprise.

    Dividing by ‘t’, as you mentioned, doesn’t quite get me there either.

    The formula in the first bullet of section 2.4 in http://www.civilized.com/files/newfourier.pdf (see Gary Knott’s post above – thanks Gary) does work (divide by 1/p (the fundmental frequency) and adjust the limits of integration to be one cycle), but I don’t follow (yet, anyway, but I’m not giving up) how we can just replace the +/-infinities in the formal definition of the integral.

    At least I finally got the answer I was looking for, but needless to say I would have failed the exam (which is why I like this blog in the first place :) ).

    Glenn

  23. The reason the Fourier transform of 1+sin(t) seems to be blowing up is because it does… The Fourier transform of a pure Fourier mode will always just be a delta function centered around the appropriate frequency. In the case of the zero frequency component, we expect zero anywhere away from zero, but an infinitely thin spike around zero.

  24. Glenn,
    I should have mentioned the 1 cycle issue. Here’s the explanation you are looking for (I hope). Since Sin and Cos are periodic, the integral over one cycle is exactly the same as the integral over an infinite number of cycles. Also, since the integral 1+sin(t)dt evaluates to t-cos(t), then divide by t to get 1-cos(t)/t. In the limit of infinity, this clearly becomes exactly equal to 1 – not to mention that cos(t) can never exceed one anyway, so this integral can never blow up – at least not with real valued t. If t is complex, I’m not sure what may happen. Why Maxima can’t cope with this probably has something to do with how it deals with the definition of infinity. Also, if I remember the deatils, the 1/p issue has to do with changing the limits of the integration to cover exactly one cycle. It is essentially the same as integrating from -2Pi to +2Pi. You might also consider forgetting about the negative frequency part of the spectrum. For all real valued data (that is, all real data!) it is exacly the mirror image of the positive spectrum anyway,

  25. Daniel,
    Are you sure about this? I’ve done a lot of fourier analysis on single frequency sine waves with and without a DC offset and indeed, the result is always a spike at the fundamental frequency of the sine wave and if there is a DC offset, another at the origin.However, these are not of infinite amplitude – quite the contrary, the heights are always exactly equal to the amplitude of the sine wave and it’s DC component. If this were not to be the case, the Fourier transform would not really be very useful for AC signal analysis. I suspect that you are thinking about some other interesting property of the transform and I would like to have you clarify what you are thinking about – perhaps the transform of the delta function?

  26. I’d be happy to explain myself. I say the Fourier Transform of \displaystyle{1+\sin(x)} has three spikes, one at \displaystyle{s=0,} and one at both \displaystyle{s=-\frac{1}{2\pi}} and \displaystyle{s=\frac{1}{2\pi}} respectively. Namely, for \displaystyle{f(x)=1+\sin(x):}

    \displaystyle{\hat{f}(s)=\delta(s)+\frac{1}{2i}\left[\delta(s-\frac{1}{2\pi})-\delta(s+\frac{1}{2\pi})\right].}

    If you don’t buy this, well, let’s just check it. According to the definition given at the beginning of the post of the Inverse Fourier Transform, we have

    \displaystyle{\int_{-\infty}^{\infty}\delta(s)+\frac{1}{2i}\left[\delta(s-\frac{1}{2\pi})-\delta(s+\frac{1}{2\pi})\right] e^{-2\pi i s x} \;ds.}

    Then when we perform the integration, the delta functions yield the integrand evaluated at the value of s that makes the argument of that delta function zero. This gives

    \displaystyle{e^0+\frac{1}{2i}\left[e^{i x}-e^{-i x}\right]=\boxed{1+\sin(x)},}
    as desired.

  27. Daniel,
    Don’t get me wrong. It is not at all that I disagreed with your assertions, especially since they are formally correct in every way. They are also really cool and insightful and your clarification is very adequate,.The confusion centers arount the traditional use of the delta function in the time domain as an infinitely high pulse of zero duration whose integral =1. Also, invoking this interpretation involves understanding a lot of really difficult math involving distributions. etc. I am also a little preplexed by the use of “s”, usually reserved for the complex variable of integration of the LaPlace transform. My only intent is to help clarify the workings of the Fourier concept using simple, approachable math.

  28. I think I can answer that question also. When the frequency domain is discrete, it makes sense to talk about non-infinite amounts of each component, as you describe. The trouble is, when the frequency domain is continuous, it makes less sense to talk about the amount at each frequency, and a “amount density” is more applicable. After all, in the real world there is not really such thing as a pure sine tone; everything has some width in frequency space. But if a finite width has noninfinitesimal “amounts” at every frequency, then the total amount is infinite, which makes no sense. This is the same principle why discussing the mass of an object in detail requires a notion of a local mass density, because if every POINT in the object had its own noninfinitesimal mass, the whole thing would have infinite mass. The Dirac delta is a formal way to revive the concept of a pure sine frequency even after we have evolved to the notion of densities. The Dirac delta is the representation of a “point mass” in the “density” way of thinking about things.

    I think what you said about the height of the transform being equal to the amplitude is correct in the discrete frequency interpretation, because there densities DON’T make sense, while “amounts” do.

  29. “But if a finite width has noninfinitesimal “amounts” at every frequency, then the total amount is infinite, which makes no sense”. The problem with this statement is that the width is finite and therefore there are only a finite number of finite amounts and the sum is therefore finite! If I recall my history,this is precisely the polemic that raged for years regarging whether in the limit, the differential becomes vanishingly small on the one hand or 0 on the other.. The point was that as the slice becomes smaller and smaller it’s contribution also becomes smaller, and in the limit, the sum converges on the integral. The argument is whether an infinite number of infintely small pieces totals up to a finite value. Certainly we know that when we integrate a simple function that the answer almost always gives us the area bounded by the curve, not an infinite value, and in this regard, for all practical considerations it does not seem to matter if we consider that the differential truly reaches 0 in the limit or not.I suppose that we could argue about this for years, just as mathematicians did in the 19th century, However, it appears that Paul Dirac must have finally resolved this debate with the invention of the Delta Function. In the interest of all the other readers of this posting, I think we should put the whole matter to rest. At least that’s what I am going to do!

  30. Yes, what you are saying is correct, but the “amounts” have to tend toward zero as the “pieces” become smaller to give a finite result. I am just explaining why setting the amount at each piece to a constant (non infinitesimal) would give trouble.

  31. @Yves: It would be great if you could post a link which explains better (no sarcastic tone in this line). It would genuinely benefit the many other people who also feel this explanation is not so good. Kalid may include few points from that link to make this article better.

  32. Seriously, can we have you education minister, for the whole world? okthnx

    a) I love you.
    b) I basically hate practically all my math teachers, for the destruction they have spread in mine, and everybody else’s mind.

  33. Math is as easy as pie! but needs someone to bake it as good as you did!
    Great!!
    Congra!

  34. I had asked Kalid about the Fourier Transform a while back and he had emailed a great brief explanation. I just returned to this site to see whether there were any updates and I’m happy to see that the Fourier Transform is on here. This is a fantastic website!

  35. Hi Genius,
    Thanks for the article ,It was awesome like always but i have a doubt.What does negative values in time mean like -1 the graph is always positive in x and y value is just projection of point in x so i can’t get negative meaning of time

  36. I just figured out how the transform works on my own. I think its “better explained” by showing how multiplying f(t) by e^iwt is really rotating in the complex plane with frequency w/2pi, and the larger the value you get integrating this over all time, the better f(t) “matched the rythm of w”. Further more, depending on where in e^iwt’s phase f(t) keeps getting bigger at periodically, that will be contributing the most to the fourier transform’s complex value. So the final value, the sum over all time of f(t)’s complex position when rotated by multiplication with e^iwt, tells you about the phase and magnitude of the match-up between w, the rotation speed, and f(t), the function being rotated. Its wierd, its very much a sort of circular integral, where depending on w, you get really far from where the value of the integral starts, or depending on how f(t) matches up with the phase of e^iwt, gives the integral’s angle in the complex plane. Its a little mathematical machine, and it is an extremely intuitive one. For instance, why divide by 2*pi? Because that is how much further a rotation in the complex plane moves a value of f(t), it moves it more by a factor of 2*pi.

  37. Hah, just a curious learner here. Negative values in time, for the signal you mean? In this case, if it’s an infinitely-repeating signal (that’s what the Fourier Transform assumes), then -1 means “1 second before the current cycle started, i.e. near the end of of the previous cycle”. Sort of like “-1AM” might mean 11PM of the night before.

  38. Hi Jose, thanks — that’s a really neat interpretation. Yep, it’s almost like a “dot product” where you are seeing how big and overlap you can get (and different phases will have different overlaps).

  39. Thanks for the explanation.
    may be this be silly but can you just brief out the terms in the formula like n,N,k sorry to ask this.

  40. @RR: Thanks

    @Satheesh: No problem, just updated the post (the Discovering the Full Transform section)

  41. The old Yamaha DX synthesizers series used frequency modulation to create, from 4 to 6 sine waveforms, quite complex sounds.

  42. @Angel: Cool background — it seems to only take a few components before the shapes get really intricate.

  43. Is there anyway to visualize orthogonal signals?Or understand it intuitively instead of just saying that their dot product is zero. I’m studying trigonometric fourier series and having a hard time grasping how each multiple of fundamental frequency component acts the same way like orthogonal vectors that when adding them together they doesn’t interfere and you can add frequency components with right amplitudes to the sum and you don’t need to correct already calculated amplitudes when adding a new term.

  44. Is there anyway to visualize orthogonal signals?Or understand it intuitively instead of just saying that their dot product is zero. I’m studying trigonometric fourier series and having a hard time grasping how each multiple of fundamental frequency component acts the same way like orthogonal vectors that when adding them together they doesn’t interfere and you can add frequency components with right amplitudes to the sum and you don’t need to correct already calculated amplitudes when adding a new term.

  45. I just wanted to learn digital signal processing… After a couple of chapters in my dsp book i noticed that i have to study signals and systems first in order to understand fully dsp. It became clear very soon that i need to learn more math especially fourier analysis to make sense of everything in my signals and systems book. I’m on chapter three now in my signals and systems book (fourier series) and it will probably take my whole life to get to a fourth.

  46. This could not get better. I have been trying to understand this concept on my own and it has been a long difficult task. But with this post of yours, my life is easy now. Keep up the good work man!

  47. The part I missed on the first 2 animations– the values listed beside “time” are amplitude values, while the timing is implied as divisions of the 1hz cycle.

    Further down I was able to use context clues. overall, EXTREMELY HELPFUL

  48. Also: The amplitude of the waveform corresponds to the X value on the circle, as opposed to the Y value like every other example i’ve seen.

    I realized it doesn’t matter which you choose, it is just a 90 degree phase shift. Because its a damn circle and X and Y are perpendicular.

    This is probably really

  49. obvious to you, but it gave me some trouble. Now i have a broader understanding.

    Sorry for the 3 separate comments

  50. @Hamppi: I see orthogonal signals as ones whose net “overlap” or contribution to the other is entirely wiped out when you multiply them piece-by-piece.

    Imagine two signals driving a car. One controls the speed, the other controls the direction. When the speed is at max, the direction might be null (no direction, the brakes). And when the direction is north, the speed might be null (no speed, the brakes). Sometimes they are both on (North at 10mph, or South at 10mph). Over all time though, the car does not move, because the sum of all contributions cancels.

    @Akshar: Thank you!

    @Ben: Great feedback, I really like knowing which parts can be clarified. I’ll update the article to make your feedback more clear. Thanks!

    @Vic: Glad you enjoyed it

  51. I was struggling with Fourier for quite some time.
    Wikipedia and other web based explanations are way too complicated for my rudimentary knowledge – and thus, useless.
    Thanks for explaining a difficult concept so elegantly.
    The metaphors /analogies were excellent while the animations are superb !
    Would you please be kind enough and consider doing the same magic and explain the concept of (Claude) Shannon Entropy ? That’s another painful concept to grasp.
    Thanks
    A. Scarlat MD

  52. @A. Scarlat MD: Really glad it clicked, thanks for the note! Yes, often times people jump into extremely technical discussions of math without laying an intuitive foundation. I’d like to do more signal processing posts later on :) .

  53. Is this presentation targeted for persons already familiar with Fourier Series?

    Think With Circles, Not Just Sinusoids:
    What is a circle? Just a circle itself? A sinusoid?, a Complex exponential? or vice versa. Why not considering a circle the son of a cone? Or maybe a circle is just a straight line for bug living in an infinite radius circle.

  54. Thank you very much for this work sharing your insights, there has been very practice for my math career, keep going!

  55. I wonder why most books about periodic phenomena most of the time instead of using circles, use a trigonometric description or even more , a complex exponential description?
    How we multiply a circle (representing AC electrical current) by another circle (representing a AC alternating “voltage”) for finding for example the instantaneus AC power. So in other words what is the geometric picture of this two circles multiplied together?
    I wonder what the circle based description would be for a two dimensional Fourier transform?

  56. If we have sinusoidal AC voltages and currents, how do we multiply the corresponding two circles for finding the instantaneus AC power? What is the geometric picture?,
    I wonder why most books use a trigonometric description or even more a complex exponential for playing with the associated math for both theoretical and practical use?
    What would be the “circle” for a two or more dimensionsonal Fourier Transform?

  57. @Anonymous: Not sure why most books jump to the most technical definition first :) . Intuitively, I imagine a circular path, and on that circular path, another circle is traveling [a bit like how the Earth moves around the sun, and the moon moves around the Earth]. The combined effect of the two positions is the net power seen.

  58. What is the practical use of this circle view approach in solving practical problems?
    For example what is the “circle” output of a linear system for any periodic “circle” input? How we represent the “circle” amplitude response and the “circle” phase response?
    What is the “circle” transfer function of a linear system?

  59. “Click graph the graph to pause/unpause.” –> “Click the graph to pause/unpause.”

  60. After years of trawling the net..;this is one place where I truly understood fourier transform

  61. Kudos! This is the best ever intuitive presentation of Fourier! And the animations…gr8 work…Thanks for the effort…Similar insights on Wavelets might be of gr8 help too…pls consider it….Thanks again…keep it going!!!

  62. This is a work of a an extremely talented and gifted person!!!
    Question – i am trying to understand what probability density functions have to do with “cyclicality”?? Because characteristic function of a probability density is Fourier Transform, so it needs to be time and cycle driven, but I just not sure what does cyclicality have to do with probability..

    Thank you!!!!!!!!!!!!!!!

  63. @Murugesh: Thanks for the note! Wavelets would be a good follow-up. I need to learn more about them.

    @Roman: Really appreciate the kind words. Interesting, I don’t know much about probability distribution functions and their relationship to the Fourier Transform, but something to study!

  64. Hello Khalid,

    All I have to say is that you have put together a wonderful article. Your style of writing immensely helps in removing the apprehension in the mind of the reader of having to deal with a complex topic.

    I am an Image Processing/Computer Vision enthusiast. I plan to write articles in this domain the help students and professionals maneuver complex topics in these subjects by presenting them in a easy to grasp manner

    My article on Fourier Transforms @ http://jasexplains.blogspot.in/ is the first write-up. Would be very thankful if you can provide your feedback.

    JAS

  65. Hi Kalid,

    I am myself writing my own website with math/signal processing/electronics content and, although I am probably not doing it as well as you are, I do believe these complex subjects can be explained in a simple way. This explanation of the Fourier Transform is an excellent example of it. Thanks.

  66. I can’t comment on the rigor or accuracy, but in my view this article is absolutely brilliant.
    Please write some textbooks.

  67. Wonderful and revelatory stuff – you make learning it a delightful experience with all the visual metaphors and animations gradually building to the abstract formulas. what a rarity – maths taught in a human way! I’ve been trying to grok the fourier transform for months with little success outside of the basic concept that it decomposes a signal into frequencies. The formulas themselves just confused me. Now i really feel I have a handle on it.

  68. Thank you for the effort in making this .
    Hope everybody who gets swamped in this domain comes here.

  69. @JAS: Glad you’re enjoying it! Yep, part of writing is getting in the head of the reader and gently going down the path, vs. blasting people with all the details up front :) . I’ll check out your article later today.

    @Hugo: Thanks for the note! I love hearing about other people doing their explanations. Everyone has a different style, so looking forward to checking out yours.

    @zenbowman: More than welcome.

    @Burke: Thanks! Hoping to do some more material on Calculus, Trig, etc. organized into a book. Stay tuned…

    @Tim: Thanks so much — exactly, why can’t we be *human beings* when talking about math? Sure, math can be written down in a way that can be used by machines, but it doesn’t mean we have to think and talk like them. Let’s use metaphors/visualizations to make the rigorous proofs more palatable.

    @andeww, Erti-Chris: Thanks!

Your feedback is welcome -- leave a reply!

Your email address will not be published.

LaTeX: $$e=mc^2$$