
Here’s a trick for thinking through problems involving exponents and logs. Just ask two questions:
Are we talking about inputs (cause of the change) or outputs (the actual change that happened?)
- Logarithms reveal the inputs that caused the growth
- Exponents find the final result of growth
Are we talking about the grower’s perspective, or an observer’s?
- e and the natural log are from the grower’s instant-by-instant perspective
- Base 10, Base 2, etc. are measurements convenient for a human observer
In my head, I put the options in a table:
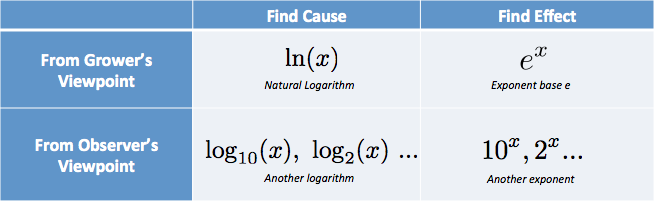
I have thoughts like “I need the cause, from the grower’s perspective… that’s the natural log.”. (Natural log is abbreviated with lowercase LN, from the high-falutin’ logarithmus naturalis.)
I was frustrated with classes that described the inner part of the table, the raw functions, without the captions that explained when to use them!
That won’t fly, let’s get direct practice thinking with logs and exponents.
Scenario: Describing GDP Growth
Here’s a typical example of growth:
- From 2000 to 2010, the US GDP changed from 9.9 trillion to 14.4 trillion
Ok, sure, those numbers show change happened. But we probably want insight into the cause: What average annual growth rate would account for this change?
Immediately, my brain thinks “logarithms” because we’re working backwards from the growth to the rate that caused it. I start with a thought like this:

A good start, but let’s sharpen it up.
First, which logarithm should we use?
By default, I pick the natural logarithm. Most events end up being in terms of the grower (not observer), and I like “riding along” with the growing element to visualize what’s happening. (Radians are similar: they measure angles in terms of the mover.)
Next question: what change do we apply the logarithm to?
We’re really just interested in the ratio between start and finish: 9.9 trillion to 14.4 trillion in 10 years. This is the same growth rate as going from $9.90 to $14.40 in the same period.
We can sharpen our thought:

 = .374}")
Ok, the cause was a rate of .374 or 37.4%. Are we done?
Not yet. Logarithms don’t know about how long a change took (we didn’t plug in 10 years, right?). They give us a rate as if all the change happened in a single time period.
The change could indeed be a single year of 37.4% continuous growth, or 2 years of 18.7% growth, or some other combination.
From the scenario, we know the change took 10 years, so the rate must have been:

From the viewpoint of instant, continuous growth, the US economy grew by 3.74% per year.
Are we done now? Not quite!
This continuous rate is from the grower’s perspective, as if we’re “riding along” with the economy as it changes. A banker probably cares about the human-friendly, year-over-year difference. We can figure this out by letting the continuous growth run for a year:


The year-over-year gain is 3.8%, slightly higher than the 3.74% instantaneous rate due to compounding. Here’s another way to put it:
- From an instant-by-instant basis, a given part of the economy is growing by 3.74%, modeled by e.0374 · years
- On a year-by-year basis, with compounding effects worked out, the economy grows by 3.81%, modeled by 1.0381years
In finance, we may want the year-over-year change which can be compared nicely with other trends. In science and engineering, we prefer modeling behavior on an instantaneous basis.
Scenario: Describing Natural Growth
I detest contrived examples like “Assume bacteria doubles every 24 hours, find its growth formula.”. Do bacteria colonies replicate on clean human intervals, and do we wait around for an exact doubling?
A better scenario: “Hey, I found some bacteria, waited an hour, and the lump grew from 2.3 grams to 2.32 grams. I’m going to lunch now. Figure out how much we’ll have when I’m back in 3 hours.”
Let’s model this. We’ll need a logarithm to find the growth rate, and then an exponent to project that growth forward. Like before, let’s keep everything in terms of the natural log to start.
The growth factor is:
 = \ln(2.32/2.3) = .0086 = .86\%}")
That’s the rate for one hour, and the general model to project forward will be

If we start with 2.32 and grow for 3 hours we’ll have:

Just for fun, how long until the bacteria doubles? Imagine waiting for 1 to turn to 2:

We can mechanically take the natural log of both sides to “undo the exponent”, but let’s think intuitively.
If 2 is the final result, then ln(2) is the growth input that got us there (some rate × time). We know the rate was .0086, so the time to get to 2 would be:
}{\text{rate}} = \frac{.693}{.0086} = 80.58}")
The colony will double after ~80 hours. (Glad you didn’t stick around?)
What Does The Perspective Change Really Mean?
Figuring out whether you want the input (cause of growth) or output (result of growth) is pretty straightforward. But how do you visualize the grower’s perspective?
Imagine we have little workers who are building the final growth pattern (see the article on exponents):
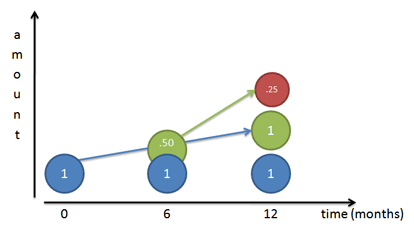
If our growth rate is 100%, we’re telling our initial worker (Mr. Blue) to work steadily and create a 100% copy of himself by the end of the year. If we follow him day-by-day, we see he does finish a 100% copy of himself (Mr. Green) at the end of the year.
But… that worker he was building (Mr. Green) starts working as well. If Mr. Green first appears at the 6-month mark, he has a half-year to work (same annual rate as Mr. Blue) and he builds Mr. Red. Of course, Mr. Red ends up being half done, since Mr. Green only has 6 months.
What if Mr. Green showed up after 4 months? A month? A day? A second? If workers begin growing immediately, we get the instant-by-instant curve defined by ex:
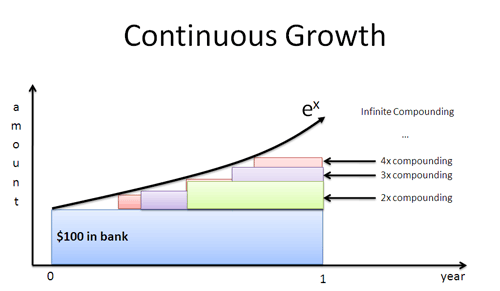
The natural log gives a growth rate in terms of an individual worker’s perspective. We plug that rate into ex to find the final result, with all compounding included.
Using Other Bases
Switching to another type of logarithm (base 10, base 2, etc.) means we’re looking for some pattern in the overall growth, not what the individual worker is doing.
Each logarithm asks a question when seeing a change:
- Log base e: What was the instantaneous rate followed by each worker?
- Log base 2: How many doublings were required?
- Log base 10: How many 10x-ings were required?
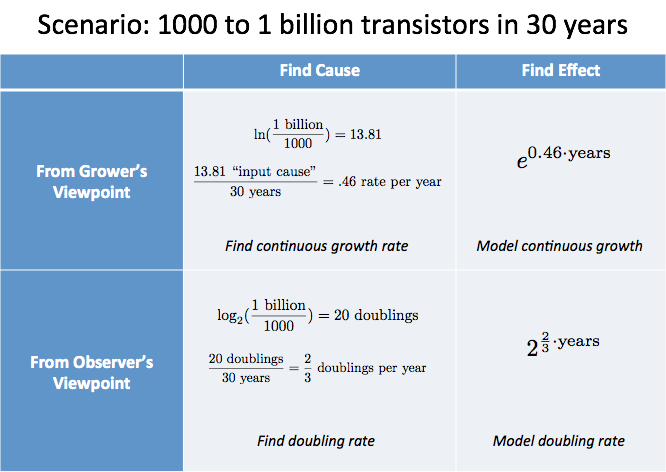
Here’s a scenario to analyze:
- Over 30 years, the transistor counts on typical chips went from 1000 to 1 billion
How would you analyze this?
- Microchips aren’t a single entity that grow smoothly over time. They’re separate editions, from competing companies, and indicate a general tech trend.
- Since we’re not “riding along” with an expanding microchip, let’s use a scale made for human convenience. Doubling is easier to think about than 10x-ing.
With these assumptions we get:
 = \log_2(\text{1 million}) \sim \text{20 doublings}}")
The “cause of growth” was 20 doublings, which we know occurred over 30 years. This averages 2/3 doublings per year, or 1.5 years per doubling — a nice rule of thumb.
From the grower’s perspective, we’d compute ln(text(1 billion)/1000) / text(30 years) = 46% continuous growth (a bit harder to relate to in this scenario).
We can summarize our analysis in a table:
Summary
Learning is about finding the hidden captions behind a concept. When is it used? What point view does it bring to the problem?
My current interpretation is that exponents ask about cause vs. effect and grower vs. observer. But we’re never done; part of the fun is seeing how we can recaption old concepts.
Happy math.
Appendix: The Change Of Base Formula
Here’s how to think about switching bases. Assuming a 100% continuous growth rate,
- ln(x) is the time to grow to x
- ln(2) is the time to grow to 2
Since we have the time to double, we can see how many would “fit” in the total time to grow to x:
}{\ln(2)} = \log_2(x)}")
For example, how many doublings occur from 1 to 64?
Well, ln(64) = 4.158. And ln(2) = .693. The number of doublings that fit is:
}{\ln(2)} = \frac{4.158}{.693} = 6}")
In the real world, calculators may lose precision, so use a direct log base 2 function if possible. And of course, we can have a fractional number: Getting from 1 to the square root of 2 is “half” a doubling, or log2(1.414) = 0.5.
Changing to log base 10 means we’re counting the number of 10x-ings that fit:
}{\ln(10)} = \log_{10}(x) }")
Neat, right? Read Using Logarithms in the Real World for more examples.


Leave a Reply
32 Comments on "How To Think With Exponents And Logarithms"
Brilliant, Kalid. Is this your day job?
Regards
Dan
I understand e, as a rate of change over time, taking account of the fact that the quantity which has grown, itself grows…very nicely explained by you. What does In mean? as for example In(x) is the time to grow to x. How should I read In…is it integrate?
@Dan: Thanks, glad you enjoyed it! My day job is actually doing web development, but I’m hoping to make this site an ever-increasing part of my life :).
@Jonathan: Whoops, I should have clarified that. ln is short for “logarithmus naturalis”, the fancy Latin name for the Natural Logarithm. I’ll fix up the article with a note, thanks for the feedback.
We “studied” logs in a trig course in 1949 at Columbia U. Back then “we” were burdened with log tables. Not a single student in the class had any idea of what was going on or what a “characteristic” or a “mantissa” was. The nearest we could make out was that it was like saying “Shazam” produced Captain Marvel, i.e., nothing made sense but if you do the right things you pass the course. (Also like “Open Sesame!” yelled at the rock in front of the cave.) But, as the old folks say, “Better late than never.” Thank you for your extraordinary hard work and insights. I also love the design of your site. You are indeed an ace web site designer.
Hi George, thanks for the note! It seems not much has changed, when I was in school we also learned things by rote. It’s now a decade later, and I’m finally making sense of the ideas I learned.
I’ve started to realize learning was never on a strict timeline, you never have “just 4 years to internalize a concept, and there’s always new intuitions to uncover when we dust off an old idea. (Also, glad you’re enjoying the site design!)
Hey Kalid- I don’t know if you recall me, but I’m moving back to Seattle!
I love this article- I was wondering what your intuition was on logistic curves, logistic regressions?
I often think of them as “depressed exponentials”- stuff that gets increasingly bogged down with whatever is limiting their growth. I think I’ll be studying more of this class of equations in my new job, but wanted to get your thoughts.
Hey Zach, that’s great! I’m thinking of doing a Seattle-area intuitive math meetup and I’ll put you down :).
You know, I haven’t really studied logistic curves very much, but I like that description. From looking around, here’s a quick stab:
A regular exponential has the property
d/dx f(x) = f(x)
that is, we’re always growing by 100% of the amount that we currently have. Resources in the environment seem unlimited — however much we have, there is enough for us to crank out helpers, who make helpers, etc.
If our resources get constrained as we get further along, it seems we’d describe our growth like this:
d/dx f(x) = f(x) * percent of growth factor remaining
Since we’re dealing with percentages now, f(x) isn’t a function of raw numbers, but a percentage of the total you can possibly have. As you reach for 10% of your possible max, you are growing by 90% of your current amount. As you get to 25% of your possible max, you are growing at 75% of your current amount.
From here it seems like we get the logistic curve:
d/dx f(x) = f(x) * (1 – f(x))
For me it seems the main shift is that f(x) is now returning a *percentage* whereas with regular e^x, we assume we’re getting an absolute amount (there is no max we’ll ever reach).
I hope this site gets increasing successful. Its value is innumerable. :)
Thanks Zenko, I appreciate it :).
You are fantastic , you explained exponential and logarthmic beautifully, i am waiting for matrices Kalid
Have to talked to the Khan Academy people. I would love to see Vi Hart and you do some videos together.
Thanks for your article. I don’t know if it’s because english is not my native tounge or I just don’t get it. Can elaborate a bit more on the grower vs the oberver viewpoint. I’m having trouble understanding it.
MUCH more helpful in explaining the computation of growth rates in finance.
Thanks Kalid!
@Ashok: Thanks! I have an intro to linear algebra & matrices here: /articles/linear-algebra-guide/
@Ben: Thanks, I’d like to do some collaboration in the future too.
@Richard: Great question, happy to clarify. You may want to check out this article: /articles/an-intuitive-guide-to-exponential-functions-e/
which goes into the scenario in more detail.
The “grower’s perspective” is the growth rate experienced by a single component, whereas the “observer’s perspective” is the growth rate after all compounding effects are taken into account.
Let’s say I invest $1000 at 2% a month.
An individual dollar just knows to grow 2% each month. At the end of the year, it thinks “I have contributed 2*12 = 24 cents to the whole”. That is true for direct contributions, but its interest earns interest! And that earns interest, and so on :).
So, to an outside observer, the total effect of “2% return every month” is really:
(1 + 2%)^12 = (1.02)^12 = 1.268 = 26.8% annual return
There are two “rates” we can describe in this scenario: the 24% rate each dollar intends on contributing over the year, or the 26.8% growth that we see after all compounding effects are worked out.
Let’s say we grew for 5 years. We could describe this as both:
Grower’s perspective: (1 + 2%)^(12 * 5) [“Take the individual monthly growth and apply it for 5 years.”]
Observer’s perspective: (1 + 26.8%)^5 [seen as “Just take the final annual growth and apply it for 5 years”]
You can hop between one perspective and the other, in science it’s usually easier to think about the contributions on a per-item basis (and then work out the result), and in finance we may just care about the final result (and don’t care about the details for what each dollar plans on contributing).
@Michael: Awesome, glad it helped.
There is no time I surf that I will not check betterexplained.com. I graduated from one of the universities in Nigeria in 2003, I did not have the confidence to go for postgraduate until I buried my head 3years from 2009 and internalised the once recondite maths ideas, before going for postgraduate study in electrical engineering. This article is again another wow!!!!!!!!. Thanks for the global inspiration that you give to all the scientists in the world.
Thank you so much for these illuminating articles! It makes thinking about exponents and logarithms *natural*.
There is one thing that seems odd to me though. It is the use of ’cause’. It seems that ‘rate’ is what is meant. Is it from a metaphor you were using somewhere else?
Hi Tom, thanks for the note. I see cause as both the rate, and the time we allowed it to grow [sometimes this is implicitly one period of time].
For example, we observed a bacteria colony that started with 1,000 members and grew to 4,000 over the course of 3.5 days.
The “cause of this change” was that some growth rate was applied for some amount of time (39.6% continuous growth, applied for 3.5 days, in this case). The effect was that 1,000 members grew to 4,000.
We can say cause = rate, but only if we’re certain we’re dealing with one unit of time.
Thanks for this but topic is far and away above my basic level. I haven’t had any reason to use logarithms in the past 50 years and have never used natural logs. Keeping on trucking. ;)
It made me think differently about exponents and logarithms . I gained lot of insight about e and natural logarithms
This website has helped me so much in so many different classes! I’m still confused as to why e is such a central number, though. I mean i get the logic behind taking the limit of (1+1/n)^n being e as your interval approaches continuity but why is does that number just happen to be 2.718… and what makes that number so much more special than any of the other infinite numbers on the numberline that it would be so important to so many different subjects and why does taking the derivative of this number to the x power always yield e^x? I asked my teachers these questions and the answer was more or less “because that’s the way natural growth works”. Is there some hidden underlying principle that I’m missing or just not getting?
Hi Mia, great question — check out the article on e for more details about how it works out to 2.718.
/articles/an-intuitive-guide-to-exponential-functions-e/
and this one on the various properties of e^x:
/articles/developing-your-intuition-for-math/
Now, on *why* it’s 2.718… and not some other number — that’s a tricky question. Why is the square root of two 1.414… and not some other number? Because 1.414… has the property that squaring it results in 2.
Similarly, 2.71828… has the property that it perfectly models continuous growth. We figure out the square root of 2 by thinking “Well, it must be greater than 1, but less than 2. Let’s try 1.5 — oh, that’s too big. How about 1.4? Close, but too small. How about 1.45? Too big. 1.41? Too small, but closer.” And so on — we iteratively walk towards the real value of the square root of 2.
For e, we figure it out by trying to model perfectly smooth growth, taking 100% interest without any gaps. If we take 100% interest in a single chunk, at the end of the year, we went from 1.0 to 2.0. But we can do better: take interest in 2 groups of 50%.
That gives us (1 + .5)^2 = 2.25. A bit better. We can take 3 groups of 33.3% interest (which gives us 2.37), or 4 groups of 25% interest, and keep going.
We hit a ceiling at 2.71828… that is, it’s our best approximation for what perfectly continuous growth looks like (just like 1.414… is our approximation of the square root of 2). We have an algorithm to give us a number with a certain property, and that’s what pops out. I can’t say why it’s 2.71828… and not 2.81828… except the latter does not match with what happens as you create growth that is smoother and smoother.
The idea of perfectly smooth growth also means e^x will be its own derivative. If we’re growing _perfectly smoothly_ by 100%, our rate of change (d/dx) must equal our current value. (That’s what 100% smooth growth means: our growth trajectory is 100% of our current amount. 50% smooth growth means our trajectory is 50% of our current amount). In math terms,
d/dx current value = current value
and to get more specific,
d/dx e^x = e^x
Hope this helps.
Great way of explaining why derivative of e^x is e^x (via Current value)
Kalid–really great job explaining it all very intuitively. That is real teaching. I wish classroom teaching was on these lines. In my school days, I had to go find many different resources befor I could intuitively understand concepts. Way you explain it is still much better and giving me new ingights even now.
As to Mia’s question–why e=2.7…. and not some other number,.. here is my 2 cents, it is because we use decimal system for our numbers. and this natural number just falls at 2.7.. in our decimal system, which was invented for our convenience (observer’s viewpoint)
Idealy if we were to re-invent number system from nature’s viewpoint, we should be using a “natural”number system–in which e woiuld fall at unity or “1”.
Kalid
After reading this article there is one aha moment for me.complex lograthim can be explained in same way, if u take log of a rotation(final result: or observer view point ) the answer will give u the angle (mover’s point of view),plz comment on this ,many many thanks to share this article may god give u happiness and fun as you spread the fun in world through your precious insights
I start to understand the concept then get confused with calculations i.e.
14.4/9.9= .374 when I do it, I get 1.454 & 2.32/2.3= .0086 I get 1.0086 ???
Any help would be appreciated
First, Khalid you’re the best. Great article, excellence.
Some Insight, you have basically said this but I would like it to be said in pure calculus terms to understand laplace functions better:
Finding the continuous growth, by inputing “x” into e^x
-Where x=rate*time
-Is ANALOGOUS TO INTEGRATION
–Integral of velocity with respect to time is distance (same as rate * time= growth where velocity is rate and dt (time) is a small portion of time and finally growth is the “distance”) (Better explanation, bottom paragraph)
Finding the cause of growth, AKA DIFFERENTIATION
ln(x) automatically gives you the rate of growth by inputting x. Same thing a derivative does.
Since e^x has a y output that has been integrated at every smallest portion of time (n tends to infinity);
Steps:
1. Input the x, which is a rate*time (already a Integrated value)
2. Perform the operation of e^x (scales the integrated value(rate*time) by inputting the information of a continuous growth operation
a) this means that depending on the size of your rate * time (if it is huge “rate”, or “time” (x depends on both) – the operation will give you a huge growth (distance, whichever way you want to think)
3. Since it is a function that describes continuous rate of growth (a number that has been integrated infinite number of times), it will always be the derivative of itself.
SOME CRITICISM/COMMENTS APPRECIATED
@Brant: Make sure you’re taking the natural log, and doing ln(14.4/9.9) and not a regular (14.4/9.9).
@Magnus: Glad you’re enjoying it. Very interesting thought, e^x and ln(x) are analogous to integration/differentiation because they are both inverses and “undo” each other. And in general, e^x will make the quantity bigger (growing for some amount of time) and ln(x) will make the quantity smaller / finding the rate of change.
I think there are some good analogues here, it can be confusing because the integral/derivative of e^x is not ln(x), but the way they switch between cause and effect is similar. The derivative is the “cause” that creates a change [observed when you integrate the derivative to build up to a final effect].
It’s still too technical to understand with my non math brain. I was fried after the first paragraph.