The Fourier Transform is one of deepest insights ever made. Unfortunately, the meaning is buried within dense equations:


Yikes. Rather than jumping into the symbols, let's experience the key idea firsthand. Here's a plain-English metaphor:
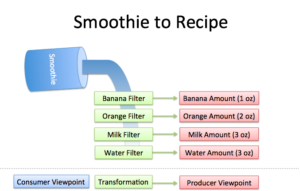
- What does the Fourier Transform do? Given a smoothie, it finds the recipe.
- How? Run the smoothie through filters to extract each ingredient.
- Why? Recipes are easier to analyze, compare, and modify than the smoothie itself.
- How do we get the smoothie back? Blend the ingredients.
Here's the "math English" version of the above:
- The Fourier Transform takes a time-based pattern, measures every possible cycle, and returns the overall "cycle recipe" (the amplitude, offset, & rotation speed for every cycle that was found).
Time for the equations? No! Let's get our hands dirty and experience how any pattern can be built with cycles, with live simulations.
If all goes well, we'll have an aha! moment and intuitively realize why the Fourier Transform is possible. We'll save the detailed math analysis for the follow-up.
This isn't a force-march through the equations, it's the casual stroll I wish I had. Onward!
From Smoothie to Recipe
A math transformation is a change of perspective. We change our notion of quantity from "single items" (lines in the sand, tally system) to "groups of 10" (decimal) depending on what we're counting. Scoring a game? Tally it up. Multiplying? Decimals, please.
The Fourier Transform changes our perspective from consumer to producer, turning What do I have? into How was it made?
In other words: given a smoothie, let's find the recipe.
Why? Well, recipes are great descriptions of drinks. You wouldn't share a drop-by-drop analysis, you'd say "I had an orange/banana smoothie". A recipe is more easily categorized, compared, and modified than the object itself.
So... given a smoothie, how do we find the recipe?
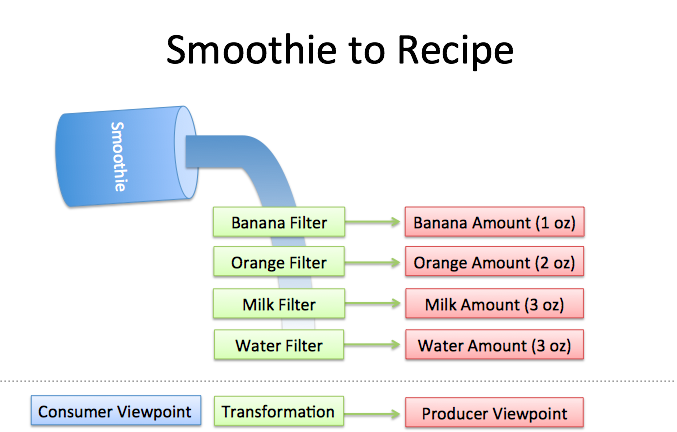
Well, imagine you had a few filters lying around:
- Pour through the "banana" filter. 1 oz of bananas are extracted.
- Pour through the "orange" filter. 2 oz of oranges.
- Pour through the "milk" filter. 3 oz of milk.
- Pour through the "water" filter. 3 oz of water.
We can reverse-engineer the recipe by filtering each ingredient. The catch?
Filters must be independent. The banana filter needs to capture bananas, and nothing else. Adding more oranges should never affect the banana reading.
Filters must be complete. We won't get the real recipe if we leave out a filter ("There were mangoes too!"). Our collection of filters must catch every possible ingredient.
Ingredients must be combine-able. Smoothies can be separated and re-combined without issue (A cookie? Not so much. Who wants crumbs?). The ingredients, when separated and combined in any order, must make the same result.
See The World As Cycles
The Fourier Transform takes a specific viewpoint: What if any signal could be filtered into a bunch of circular paths?
Whoa. This concept is mind-blowing, and poor Joseph Fourier had his idea rejected at first. (Really Joe, even a staircase pattern can be made from circles?)
And despite decades of debate in the math community, we expect students to internalize the idea without issue. Ugh. Let's walk through the intuition.
The Fourier Transform finds the recipe for a signal, like our smoothie process:
- Start with a time-based signal
- Apply filters to measure each possible "circular ingredient"
- Collect the full recipe, listing the amount of each "circular ingredient"
Stop. Here's where most tutorials excitedly throw engineering applications at your face. Don't get scared; think of the examples as "Wow, we're finally seeing the source code (DNA) behind previously confusing ideas".
If earthquake vibrations can be separated into "ingredients" (vibrations of different speeds & amplitudes), buildings can be designed to avoid interacting with the strongest ones.
If sound waves can be separated into ingredients (bass and treble frequencies), we can boost the parts we care about, and hide the ones we don't. The crackle of random noise can be removed. Maybe similar "sound recipes" can be compared (music recognition services compare recipes, not the raw audio clips).
If computer data can be represented with oscillating patterns, perhaps the least-important ones can be ignored. This "lossy compression" can drastically shrink file sizes (and why JPEG and MP3 files are much smaller than raw .bmp or .wav files).
If a radio wave is our signal, we can use filters to listen to a particular channel. In the smoothie world, imagine each person paid attention to a different ingredient: Adam looks for apples, Bob looks for bananas, and Charlie gets cauliflower (sorry bud).
The Fourier Transform is useful in engineering, sure, but it's a metaphor about finding the root causes behind an observed effect.
Think With Circles, Not Just Sinusoids
One of my giant confusions was separating the definitions of "sinusoid" and "circle".
- A "sinusoid" is a specific back-and-forth pattern (a sine or cosine wave), and 99% of the time, it refers to motion in one dimension.
- A "circle" is a round, 2d pattern you probably know. If you enjoy using 10-dollar words to describe 10-cent ideas, you might call a circular path a "complex sinusoid".
Labeling a circular path as a "complex sinusoid" is like describing a word as a "multi-letter". You zoomed into the wrong level of detail. Words are about concepts, not the letters they can be split into!
The Fourier Transform is about circular paths (not 1-d sinusoids) and Euler's formula is a clever way to generate one:
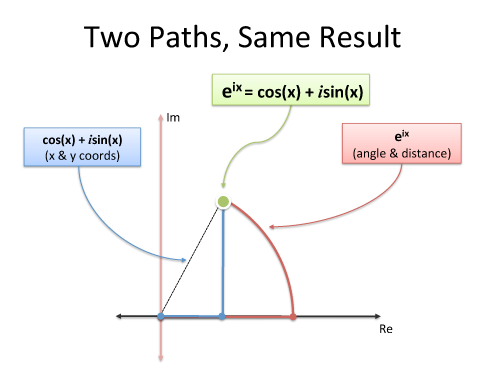
Must we use imaginary exponents to move in a circle? Nope. But it's convenient and compact. And sure, we can describe our path as coordinated motion in two dimensions (real and imaginary), but don't forget the big picture: we're just moving in a circle.
Following Circular Paths
Let's say we're chatting on the phone and, like usual, I want us to draw the same circle simultaneously. (You promised!) What should I say?
- How big is the circle? (Amplitude, i.e. size of radius)
- How fast do we draw it? (Frequency. 1 circle/second is a frequency of 1 Hertz (Hz) or 2*pi radians/sec)
- Where do we start? (Phase angle, where 0 degrees is the x-axis)
I could say "2-inch radius, start at 45 degrees, 1 circle per second, go!". After half a second, we should each be pointing to: starting point + amount traveled = 45 + 180 = 225 degrees (on a 2-inch circle).
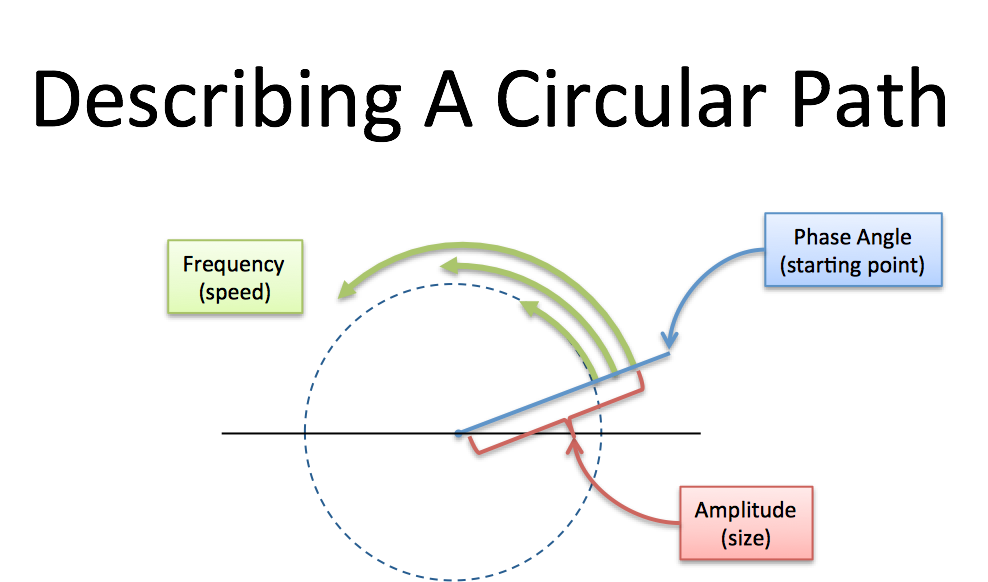
Every circular path needs a size, speed, and starting angle (amplitude/frequency/phase). We can even combine paths: imagine tiny motorcars, driving in circles at different speeds.
The combined position of all the cycles is our signal, just like the combined flavor of all the ingredients is our smoothie.
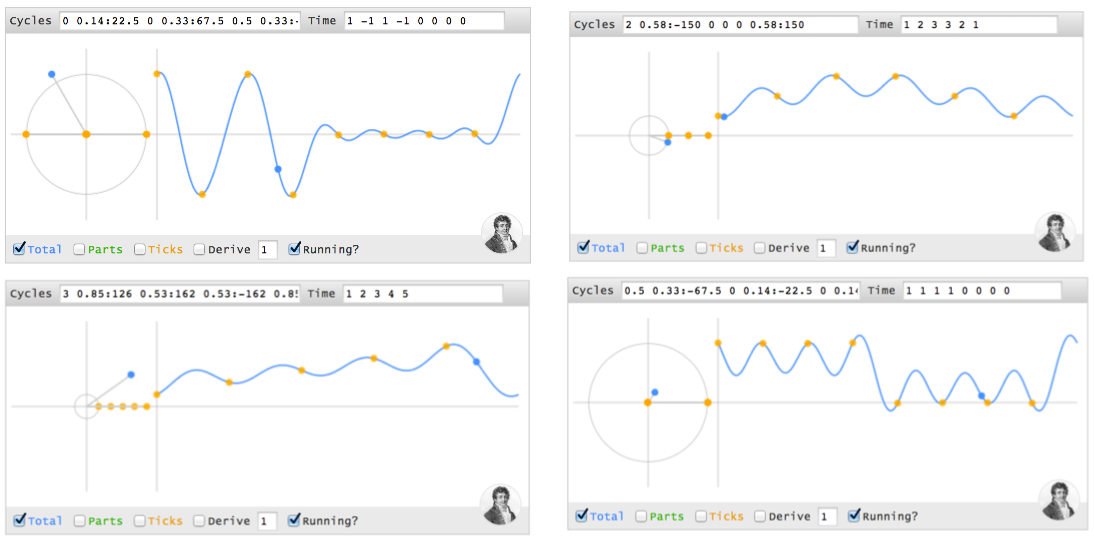
Here's a simulation of a basic circular path:
(Based on this animation, here's the source code. Modern browser required. Click the graph to pause/unpause.)
The magnitude of each cycle is listed in order, starting at 0Hz. Cycles [0 1] means
- 0 amplitude for the 0Hz cycle (0Hz = a constant cycle, stuck on the x-axis at zero degrees)
- 1 amplitude for the 1Hz cycle (completes 1 cycle per time interval)
Now the tricky part:
- The blue graph measures the real part of the cycle. Another lovely math confusion: the real axis of the circle, which is usually horizontal, has its magnitude shown on the vertical axis. You can mentally rotate the circle 90 degrees if you like.
- The time points are spaced at the fastest frequency. A 1Hz signal needs 2 time points for a start and stop (a single data point doesn't have a frequency). The time values
[1 -1]shows the amplitude at these equally-spaced intervals.
With me? [0 1] is a pure 1Hz cycle.
Now let's add a 2Hz cycle to the mix. [0 1 1] means "Nothing at 0Hz, 1Hz of amplitude 1, 2Hz of amplitude 1":
Whoa. The little motorcars are getting wild: the green lines are the 1Hz and 2Hz cycles, and the blue line is the combined result. Try toggling the green checkbox to see the final result clearly. The combined "flavor" is a sway that starts at the max and dips low for the rest of the interval.
The yellow dots are when we actually measure the signal. With 3 cycles defined (0Hz, 1Hz, 2Hz), each dot is 1/3 of the way through the signal. In this case, cycles [0 1 1] generate the time values [2 -1 -1], which starts at the max (2) and dips low (-1).
Oh! We can't forget phase, the starting angle! Use magnitude:angle to set the phase. So [0 1:45] is a 1Hz cycle that starts at 45 degrees:
This is a shifted version of [0 1]. On the time side we get [.7 -.7] instead of [1 -1], because our cycle isn't exactly lined up with our measuring intervals, which are still at the halfway point (this could be desired!).
The Fourier Transform finds the set of cycle speeds, amplitudes and phases to match any time signal.
Our signal becomes an abstract notion that we consider as "observations in the time domain" or "ingredients in the frequency domain".
Enough talk: try it out! In the simulator, type any time or cycle pattern you'd like to see. If it's time points, you'll get a collection of cycles (that combine into a "wave") that matches your desired points.
But… doesn't the combined wave have strange values between the yellow time intervals? Sure. But who's to say whether a signal travels in straight lines, or curves, or zips into other dimensions when we aren't measuring it? It behaves exactly as we need at the equally-spaced moments we asked for.
Making A Spike In Time
Can we make a spike in time, like (4 0 0 0), using cycles? I'll use parentheses () for a sequence of time points, and brackets [] for a sequence of cycles.
Although the spike seems boring to us time-dwellers (one data point, that's it?), think about the complexity in the cycle world. Our cycle ingredients must start aligned (at the max value, 4) and then "explode outwards", each cycle with partners that cancel it in the future. Every remaining point is zero, which is a tricky balance with multiple cycles running around (we can't just "turn them off").
Let's walk through each time point:
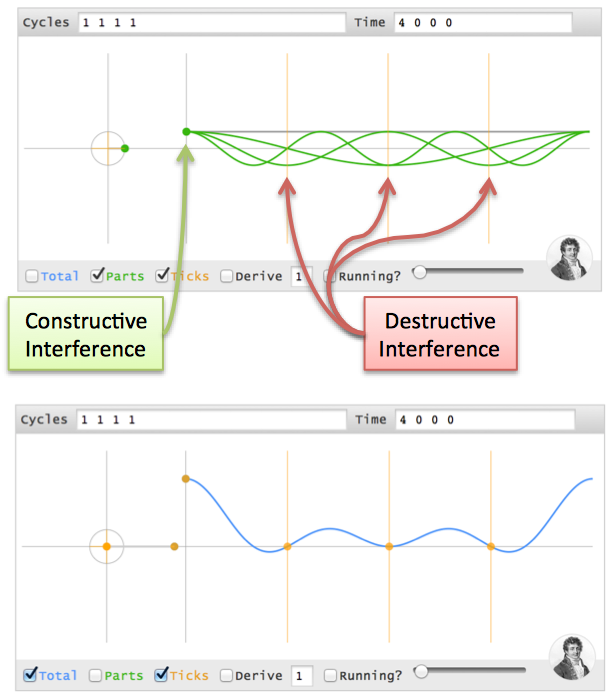
At time 0, the first instant, every cycle ingredient is at its max. Ignoring the other time points,
(4 ? ? ?)can be made from 4 cycles (0Hz 1Hz 2Hz 3Hz), each with a magnitude of 1 and phase of 0 (i.e., 1 + 1 + 1 + 1 = 4).At every future point (t = 1, 2, 3), the sum of all cycles must cancel.
Here's the trick: when two cycles are on opposites sides of the circle (North & South, East & West, etc.) their combined position is zero (3 cycles can cancel if they're spread evenly at 0, 120, and 240 degrees).
Imagine a constellation of points moving around the circle. Here's the position of each cycle at every instant:
Time 0 1 2 3
------------
0Hz: 0 0 0 0
1Hz: 0 1 2 3
2Hz: 0 2 0 2
3Hz: 0 3 2 1
Notice how the the 3Hz cycle starts at 0, gets to position 3, then position "6" (with only 4 positions, 6 modulo 4 = 2), then position "9" (9 modulo 4 = 1).
When our cycle is 4 units long, cycle speeds a half-cycle apart (2 units) will either be lined up (difference of 0, 4, 8…) or on opposite sides (difference of 2, 6, 10…).
OK. Let's drill into each time point:
- Time 0: All cycles at their max (total of 4)
- Time 1: 1Hz and 3Hz cancel (positions 1 & 3 are opposites), 0Hz and 2Hz cancel as well. The net is 0.
- Time 2: 0Hz and 2Hz line up at position 0, while 1Hz and 3Hz line up at position 2 (the opposite side). The total is still 0.
- Time 3: 0Hz and 2Hz cancel. 1Hz and 3Hz cancel.
- Time 4 (repeat of t=0): All cycles line up.
The trick is having individual speeds cancel (0Hz vs 2Hz, 1Hz vs 3Hz), or having the lined-up pairs cancel (0Hz + 2Hz vs 1Hz + 3Hz).
When every cycle has equal power and 0 phase, we start aligned and cancel afterwards. (I don't have a nice proof yet -- any takers? -- but you can see it yourself. Try [1 1], [1 1 1], [1 1 1 1] and notice the signals we generate: (2 0), (3 0 0), (4 0 0 0)).
In my head, I label these signals as "time spikes": they have a value for a single instant, and are zero otherwise (the fancy name is a delta function.)
Here's how I visualize the initial alignment, followed by a net cancellation:
Moving The Time Spike
Not everything happens at t=0. Can we change our spike to (0 4 0 0)?
It seems the cycle ingredients should be similar to (4 0 0 0), but the cycles must align at t=1 (one second in the future). Here's where phase comes in.
Imagine a race with 4 runners. Normal races have everyone lined up at the starting line, the (4 0 0 0) time pattern. Boring.
What if we want everyone to finish at the same time? Easy. Just move people forward or backwards by the appropriate distance. Maybe granny can start 2 feet in front of the finish line, Usain Bolt can start 100m back, and they can cross the tape holding hands.
Phase shifts, the starting angle, are delays in the cycle universe. Here's how we adjust the starting position to delay every cycle 1 second:
- A 0Hz cycle doesn't move, so it's already aligned
- A 1Hz cycle goes 1 revolution in the entire 4 seconds, so a 1-second delay is a quarter-turn. Phase shift it 90 degrees backwards (-90) and it gets to phase=0, the max value, at t=1.
- A 2Hz cycle is twice as fast, so give it twice the angle to cover (-180 or 180 phase shift -- it's across the circle, either way).
- A 3Hz cycle is 3x as fast, so give it 3x the distance to move (-270 or +90 phase shift)
If time points (4 0 0 0) are made from cycles [1 1 1 1], then time points (0 4 0 0) are made from [1 1:-90 1:180 1:90]. (Note: I'm using "1Hz", but I mean "1 cycle over the entire time period").
Whoa -- we're working out the cycles in our head!
The interference visualization is similar, except the alignment is at t=1.
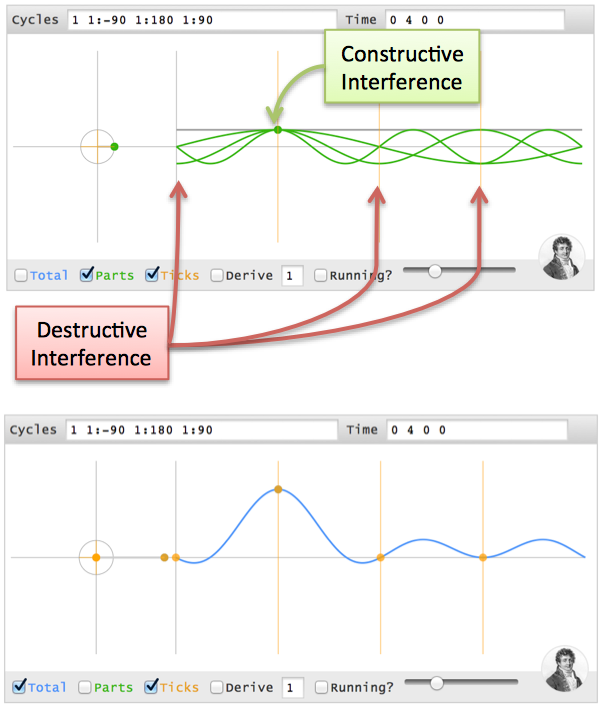
Test your intuition: Can you make (0 0 4 0), i.e. a 2-second delay? 0Hz has no phase. 1Hz has 180 degrees, 2Hz has 360 (aka 0), and 3Hz has 540 (aka 180), so it's [1 1:180 1 1:180].
Discovering The Full Transform
The big insight: our signal is just a bunch of time spikes! If we merge the recipes for each time spike, we should get the recipe for the full signal.
The Fourier Transform builds the recipe frequency-by-frequency:
- Separate the full signal (a b c d) into "time spikes": (a 0 0 0) (0 b 0 0) (0 0 c 0) (0 0 0 d)
- For any frequency (like 2Hz), the tentative recipe is "a/4 + b/4 + c/4 + d/4" (the amplitude of each spike is split among all frequencies)
- Wait! We need to offset each spike with a phase delay (the angle for a "1 second delay" depends on the frequency).
- Actual recipe for a frequency = a/4 (no offset) + b/4 (1 second offset) + c/4 (2 second offset) + d/4 (3 second offset).
We can then loop through every frequency to get the full transform.
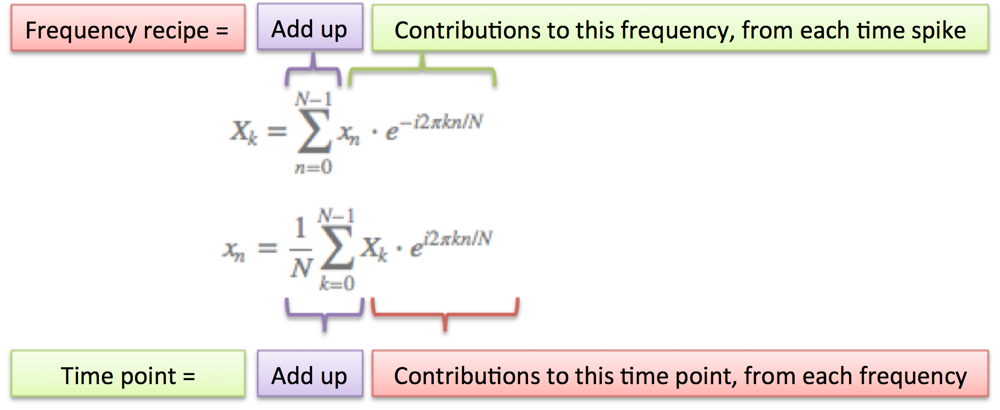
Here's the conversion from "math English" to full math:
A few notes:
- N = number of time samples we have
- n = current sample we're considering (0 .. N-1)
- xn = value of the signal at time n
- k = current frequency we're considering (0 Hertz up to N-1 Hertz)
- Xk = amount of frequency k in the signal (amplitude and phase, a complex number)
- The 1/N factor is usually moved to the reverse transform (going from frequencies back to time). This is allowed, though I prefer 1/N in the forward transform since it gives the actual sizes for the time spikes. You can get wild and even use $1/\sqrt{N}$ on both transforms (going forward and back creates the 1/N factor).
- n/N is the percent of the time we've gone through. 2 * pi * k is our speed in radians / sec. e^-ix is our backwards-moving circular path. The combination is how far we've moved, for this speed and time.
- The raw equations for the Fourier Transform just say "add the complex numbers". Many programming languages cannot handle complex numbers directly, so you convert everything to rectangular coordinates and add those.
Onward
This was my most challenging article yet. The Fourier Transform has several flavors (discrete/continuous/finite/infinite), covers deep math (Dirac delta functions), and it's easy to get lost in details. I was constantly bumping into the edge of my knowledge.
But there's always simple analogies out there -- I refuse to think otherwise. Whether it's a smoothie or Usain Bolt & Granny crossing the finish line, take a simple understanding and refine it. The analogy is flawed, and that's ok: it's a raft to use, and leave behind once we cross the river.
I realized how feeble my own understanding was when I couldn't work out the transform of (1 0 0 0) in my head. For me, it was like saying I knew addition but, gee whiz, I'm not sure what "1 + 1 + 1 + 1" would be. Why not? Shouldn't we have an intuition for the simplest of operations?
That discomfort led me around the web to build my intuition. In addition to the references in the article, I'd like to thank:
- Scott Young, for the initial impetus for this post
- Shaheen Gandhi, Roger Cheng, and Brit Cruise for kicking around ideas & refining the analogy
- Steve Lehar for great examples of the Fourier Transform on images
- Charan Langton for her detailed walkthrough
- Julius Smith for a fantastic walkthrough of the Discrete Fourier Transform (what we covered today)
- Bret Victor for his techniques on visualizing learning
Today's goal was to experience the Fourier Transform. We'll save the advanced analysis for next time.
Happy math.
Appendix: Projecting Onto Cycles
Stuart Riffle has a great interpretation of the Fourier Transform:
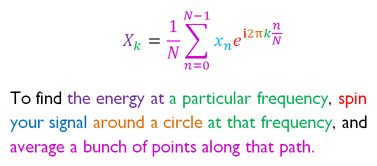
Imagine spinning your signal in a centrifuge and checking for a bias. I have a correction: we must spin backwards (the exponent in the equation above should be $e^{-i 2 \pi...}$). You already know why: we need a phase delay so spikes appear in the future.
Appendix: Another Awesome Visualization
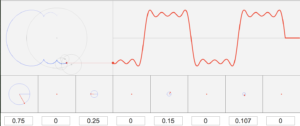
Lucas Vieira, author of excellent Wikipedia animations, was inspired to make this interactive animation:
Fourier Toy - Click to download, requires flash
(Detailed list of control options)
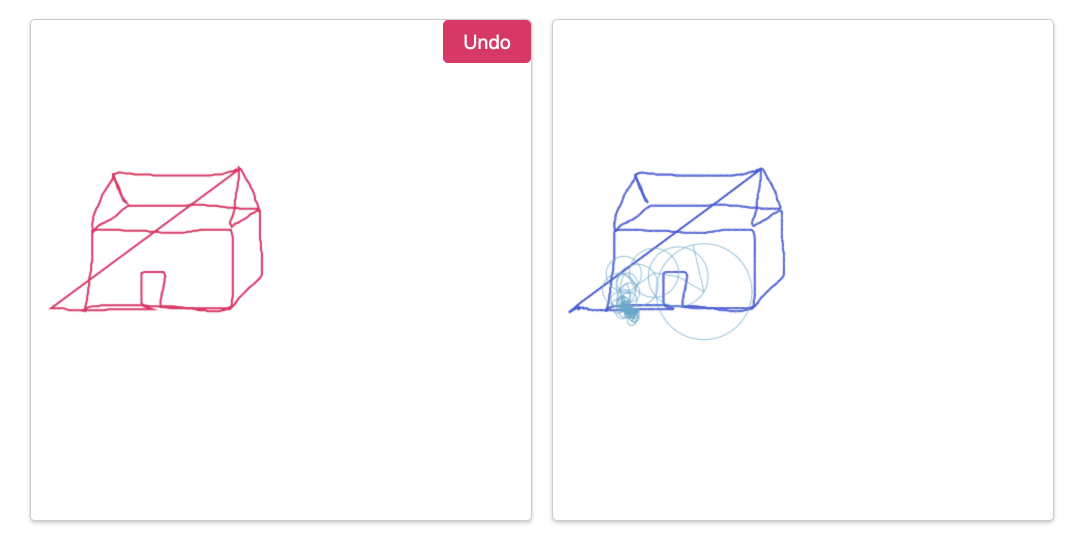
The Fourier Transform is about cycles added to cycles added to cycles. Try making a "time spike" by setting a amplitude of 1 for every component (press Enter after inputting each number). Fun fact: with enough terms, you can draw any shape, even Homer Simpson.
Check out http://www.jezzamon.com/fourier/ for a great tool to draw any shape using epicycles.
Appendix: Article with R code samples
João Neto made a great writeup, with technical (R) code samples here:
http://www.di.fc.ul.pt/~jpn/r/fourier/fourier.html
Appendix: Using the code
All the code and examples are open source (MIT licensed, do what you like).
- Interactive example (view source)
- Github gist
- Reddit discussion on details of the computation, I'm pb_zeppelin
Other Posts In This Series
- A Visual, Intuitive Guide to Imaginary Numbers
- Intuitive Arithmetic With Complex Numbers
- Understanding Why Complex Multiplication Works
- Intuitive Guide to Angles, Degrees and Radians
- Intuitive Understanding Of Euler's Formula
- An Interactive Guide To The Fourier Transform
- Intuitive Guide to Convolution
- Intuitive Understanding of Sine Waves
- An Intuitive Guide to Linear Algebra
- A Programmer's Intuition for Matrix Multiplication
- Imaginary Multiplication vs. Imaginary Exponents
- Intuitive Guide to Hyperbolic Functions
