Understanding Debt, Risk and Leverage

I don’t understand all the dominoes in the financial crisis. In situations like this, it’s helpful to step away and look at general principles: never mind the pieces, what’s the “gravity” that makes them fall? And fall so hard?

Leverage. Leverage is debt used for investment purposes, and is extremely important. Why?

  • Debt, when invested, multiplies return (profits and losses)

Leverage is a multiplier, a super-power. Super-strength is great when times are good, and horrific when you accidentally “bite your tongue” (it’s super-strength, not invulnerability). Concepts like leverage are casually mentioned, but let’s see why the dominoes fall.

Get Rich Quick

I’ve got a great investment plan for you. Ready?

  • Step 1: Withdraw all your money
  • Step 2: Go to Las Vegas
  • Step 3: Bet it all on red in roulette (Get it right and double your money — get it wrong and lose it all)

It’s perfect! We’ll double our money in one step.

Sure, there’s a “chance” that things go wrong. But even then it’s no so bad — we’ll be at zero, like the day we were born. Presumably naked and crying as well.

Double My Money? But I Want More!

The plan sounds interesting, but there’s a problem — what if I only have \$100? Doubling to \$200 is nice, but not life-changing.

A few wild thoughts later, and we’re onto a better idea: let’s borrow money! The plan becomes exciting:

  • Take our \$100 and borrow \$1,000,000 from friends, families, banks, and unsavory characters. (How? Well, show different people our \$100 and ask to borrow another \$100, with our original cash as collateral).
  • Go to Vegas
  • Bet the \$1M dollars on black! I mean, red!

What happens now?

If we win: we get \$2M, pay back our \$1M loan, and are sitting pretty with our profit of \$1M.

And if we lose? Uh oh. Now we’re worse than naked: we’ve lost our shirts and everyone else’s too! Because we took debt, our worst case scenario is no longer going broke — it’s going negative.

Notice how the loan changed the outcomes — neither wild riches nor debtor’s prison were possible without the loan.

The Risk Multiplier

What just happened? Debt multiplies our risk and reward. The good times get great, and the bad times become awful. In our example, we went from winning or losing \$100 to winning or losing \$1M — a 10,000x difference in profit and loss!

This effect from investing debt is called “leverage”. Why?

I suppose it’s because a lever lets you move one end a tiny bit (one inch) and have the other side move a large amount (1 foot). It’s also called a leverage or gearing ratio — move the big gear one cycle and move the small gear many cycles.

My inner geek cringes, since the sides of a lever move in opposite directions (one side up, one side down) and same with the gears (one side clockwise, the other counter-clockwise). Remember that with financial leverage, both sides move the same way.

I imagine leverage as a game of follow-the-leader: I push my money in one direction (making a bet), and the huge pile of money I borrowed does the same.

Use whatever analogy works for you — the key is if your money wiggles up or down, the borrowed money does the same.
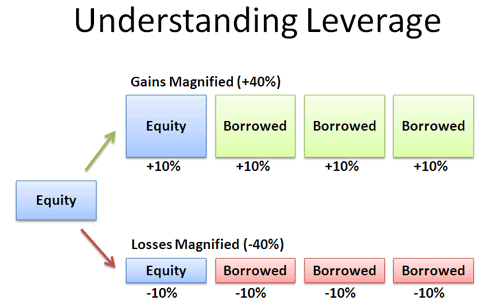
leverage example

The Risk and Benefit of Leverage

Why does leverage work? At its heart, you are borrowing someone’s assets and reaping the benefits. It’s like borrowing a cow and selling the milk! What a great idea!

It’s great until the cow runs off. Now you’re stuck — you owe a cow and don’t have one to return. The risk of leverage is investing that debt and losing what you borrowed, which can wipe out any profits.

Let’s try a more realistic example then roulette: investing in a house. Suppose you have 10k and borrow 90k, to purchase a \$100k house. You have a leverage ratio of 10:1 — for every 10 dollars of the asset, you’ve put in 1 dollar of equity (your own money).

If house prices rise by 10%, how much did you make? At first blush we’d say 10%, which is true — but you made 10% on the entire 100k! The house is now worth 110k, and after paying your 90k debt you’re left with 20k. That 10% growth became 100% profit on your initial investment!

  • leverage ratio = asset / equity
  • return = leverage ratio * percent change

Again, with 10x leverage, 10% growth becomes 100% return on our initial equity. From our analogy, we were in “control” of 10 dollars for every 1 we put in. So, we gained 10x the profit.

Now what about the reverse — when the house falls 10% to 90k?

Well, we can sell the house for 90k, pay off our loan (90k) and are left with… zero! Similarly, a 10% dip in prices becomes a 100% loss of equity — we’re wiped out! We get 10x the loss when prices go south.

And if the house price falls 20% (impossible! improbable! unlikely!), we suffer a 200% loss — we’ve lost our initial 10k and owe 10k beyond that (sell the house for 80k, but the loan is still 90k).

Hopefully the magnifying effect of borrowed money is becoming clear. You lose your equity when the investment drops 1/leverage ratio — in this case, 1/10 or 10%. With a 25x leverage ratio, the investment only needs to drop 4% in order to be wiped out. One way to think about it: you’re paying for losses out of your own pocket, not the borrowed money (you always have to pay it back). Your pocket is only 1 dollar of the 10, so once you lose it (1 dollar out of 10, or 10%) you are wiped out. Any more, and you’re in debt.

Real-world Examples

Leverage appears all over finance, but sometimes in disguise. Let’s take a look:

Getting a mortgage: As we saw, borrowing money to buy a house is a form of leverage. With 5% down (a 20x gearing ratio), your house only needs to drop by 5% to lose money. With 0% down, your house has to drop… wait for it… any amount for you to lose! And after your house is worth less than your mortgage, there’s little incentive to pay it off (better to go bankrupt, depending on the debt).

Lending money for a mortgage: Even banks are levered. When they offer money, where do you think they get it? From deposits! They borrow your deposits to loan it out to other people. If they have 10k of deposits they might loan out 100k (there’s some magic that happens here, how banks loan more money than they have; that’s for another time). If they loaned money for a house, and the house drops 10% in value and the debtor doesn’t pay, the bank has lost all if its deposits.

Offering mortgage insurance: Insurance companies might have 10k worth of cash, and offer 100k worth of insurance coverage to banks (C’mon, did you really think the insurance company had enough to pay off everyone’s claims?). Of course they don’t expect everyone to file a claim, but if even 10% of people do, they are wiped out. There isn’t an explicit loan, but the insurance company has created an obligation to pay (called the insurance leverage ratio).

See the set up? When prices are rising:

  • Owners are making a lot of money (they leveraged the house)
  • Banks are making a lot of money (they leveraged their loans, and earn a lot of interest on the borrowed money)
  • Insurance companies are making a lot of money (they’re offer more coverage, which means more premiums)

If the music stops and house prices fall, problems arise:

  • Borrowers lose equity — a 5% drop when 20x levered means the borrower is wiped out. Any more and the loan is worth more than the house.
  • Banks lose loans — if 5% of loans go bad, the banks have to pay for the lost value themselves.
  • Insurance companies lose money — if 5% of claims are called in, when the insurance company is 20x levered, it means the company has lost all of its assets!

For 20x leverage, a 5% drop would wipe you out to zero equity. Any more and you’re going negative — you’re at zero equity and still owe money!

The Lessons

I don’t understand the crisis, but I’m getting a grasp on leverage: it’s the gravity that pulls down the dominoes. In fact, it can multiply the dominoes as they fall! Here are the key points:

  • Leverage multiplies profits and losses: You can make a “regular” investment swing as wildly as you like by borrowing money.
  • Return = leverage ratio * percent change: A meager 10x gearing ratio can double your money with a 10% gain, or wipe you out with a 10% loss. By the end of a crisis, some banks increased their leverage ratio to 30:1 — if prices fell even 3% they would be wiped out!
  • Leverage appears everywhere: Companies have debt/equity ratios (how levered they are) and stock portfolios have beta (riskiness beyond the market average, which is increased by debt). Whenever you see debt or investment, look to see if it’s leveraged in some way.

Leverage make the boom times better and the busts harsher. The financial crisis has many other effects in play (such as the liquidity crisis, which makes it difficult to sell the assets you have to pay off your debts), but let’s take one idea at a time. A good friend found somepodcasts on the crisis — if you’ve found a resource that helps you get the crisis, feel free to share it below.
Join 450k Monthly Readers

Enjoy the article? There's plenty more to help you build a lasting, intuitive understanding of math. Join the newsletter for bonus content and the latest updates.

Understanding Accounting Basics (ALOE and Balance Sheets)

In accounting, the math usually isn't worse than multiplication. But accounting isn't about math -- it's about concepts, and some had me confused. Accounting has simple and surprisingly elegant ways to track a business.

So What's Accounting About, Anyway?

To be blunt, accounting is about tracking stuff (yes, there's more to it, but hang with me). What kind of stuff can we track?

  • Assets: Stuff inside the company
  • Liabilities: Stuff that belongs to others
  • Owner's Equity (aka Capital): Stuff that belongs to the owners

Simple enough. Now how are these related?

Assets = Liabilities + Owner's Equity

In layman's terms, everything the company has belongs to the owners or someone else. Think of the equation like this:

  • assets = liabilities + owner's equity
  • stuff the company has = other people's stuff + owner's stuff

This formula (also called ALOE) might seem strange at first. Why do we add liabilities and equity? Because we're looking from the point of view of the company, not the shareholders. If the company has something, it could be owed to someone else.

From the owner's point of view, owner's equity = assets - liabilities. This equation looks more natural, but often we aren't interested in the owner's point of view. We want to know about the company.

What's a balance sheet?

A balance sheet is a document that tracks a company's assets, liabilities and owner's equity at a specific point in time. As you know, if the company's has something, it belongs to someone. The sides must balance. So let's do an example.

Suppose we start a company with \$100 cash:

Assets:
  Cash: 100
Liabilities:
  None
Owner's Equity:
  Stock: 100

The company has \$100 in short-term investments, and the owners have \$100 worth of stock (how ownership is represented in a company).

Now suppose we take a bank loan for \$150. The balance sheet becomes this:

Assets:
  Cash: 250
Liabilities:
  Loans: 150
Owner's Equity
  Stock: 100

Now our company has \$250, but \$150 belongs to the bank and \$100 belongs to the owners. Sorry guys -- you can't take out a loan and make your share of the company more valuable.

Next, let's buy a building for \$200:

Assets:
  Cash: 50
  Building: 200
Liabilities:
  Loans: 150
Owner's Equity
  Stock: 100

Buying a building doesn't make our company more valuable: we re-arranged our assets. Instead of \$250 in cash, we have \$50 in cash and \$200 in "building". Our share of the company (\$100) didn't change a lick. And we still owe the bank \$150.

That's not how it really works, is it?

It is. Well, real accountants use fancier terms ("accounts receivable" vs "deadbeats who owe me"), and have a bigger, badder balance sheet. But the core idea is the same: show what the company's worth, and who owns what.

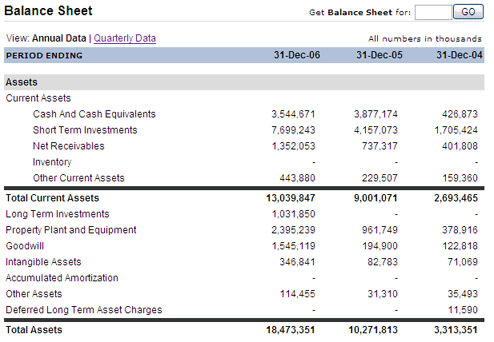
Take a look at the balance sheet for a small internet company:

Assets are broken into short-and long-term categories; the company is worth about \$18 billion on the books (as of Dec 2006). This is up from \$10B in 2005.

There's many, many reasons why assets may be over or under-valued on the books. How do you measure momentum? Employee morale? A brand? Customer loyalty?

Accountants try to quantify items like this with intangible terms like "Goodwill", but it's not easy. In reality, most companies are worth several times their reported assets; Google's market cap is over 10x the book value (but read more about stocks to see why market cap is not quite right).

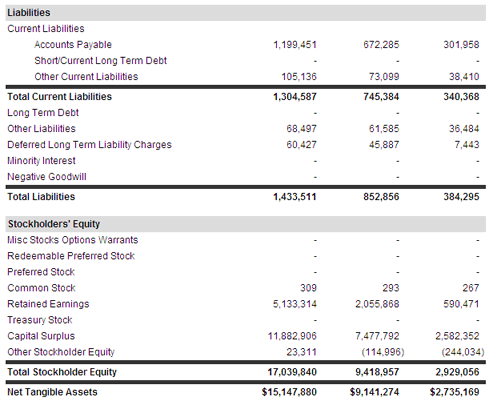
Now examine the other side of the equation, liabilities and owner's equity:

Wow -- Google doesn't have many liabilities! Only \$1.4B (of the total \$18B) and there's no long-term debt. What it does owe are "accounts payable" -- the equivalent of a credit-card bill (usually paid within a short timeframe).

Now you can examine a company and see what it's worth (on paper) and where the value lies. Google has no "inventory" (ever bought an off-the-shelf product from them?) but has a lot of cash, investments, and equipment. There's very little debt and other liabilities, so it seems like a very stable company on paper; they won't be going bankrupt anytime soon (there's other documents that show how profitable the company is).

Blockbuster, for example, has 2.5B in assets but 1.9B is owed to others (saved balance sheet here). Shareholders aren't left with much. In fact, it has 700M in "intangible assets", so it actually has a negative amount of real, tangible assets. Not a good sign -- if you liquidated the company today, it couldn't pay off its debt.

The Rules of the Game

Accounting has many rules, but a basic one is this: use double-entry bookkeeping.

This fancy term means that all changes happen in pairs:

  • If assets go down, liabilities or owner's equity should decrease also
  • If assets go up, liabilities or owner's equity must increase as well

Every change to assets must have a corresponding change to keep the equation in balance. There's a formal system of "debits and credits" that describes these changes, but the concept is simple: if you make a change to one side, you must make one on the other as well.

There's More to Learn

There's much more to accounting, but you've got an idea of the basics:

  • If a company has something, someone had better own it
  • A balance sheet lists assets, liabilities and owner's equity at a point in time; everything must add up
  • Changes must be made in pairs: if assets, liabilities or owner's equity changes, something else much change as well

Any system can be interesting (even "fun") if you look at the reasons it was created and the problem it's trying to solve. Could you have made a simpler way to report what a company is worth and who is owed what?

Enjoy.

Join 450k Monthly Readers

Enjoy the article? There's plenty more to help you build a lasting, intuitive understanding of math. Join the newsletter for bonus content and the latest updates.

What You Should Know About The Stock Market

Everyone’s heard of the stock market — but few know why it works. Were you aware that each stock has two prices? That you can’t buy and sell for the same amount? That a “stock market” works better and is more open than a “stock store”?

If you’re like most of us, probably not. Here’s why stock markets rock:

  • They match buyers and sellers efficiently
  • All prices are transparent and you see what other people have paid/sold for
  • You name your own price and get that price if there’s a willing partner

Most explanations jump into the minor details — not here. Today we’ll see why the stock market works as it does.

iPhones Ahoy!

I’m told iPhones are popular with the 18-35 demographic. A market research firm asked me to find a good selling price, so I’ll pass the question onto you:

Me: You, the coveted 18-35 year old demographic, want an iPhone. What’s it worth?

You: Dude, just get the price. Duh.

Ok hotshot, riddle me this: what is the price, exactly?

  • What you can buy it for? (Your best bid)
  • What you can sell it for? (What you’d ask for it)

So which price is the “real one”? Both.

You see, buyers and sellers each have prices in mind. When prices match, whablamo, there’s a transaction (no match, no whablamo).

The idea of two prices for every item is key to understanding any market, not just stocks. Everything has a bid and an ask, and each shopping model has a different way of handling them. This leads to different advantages for buyers and sellers.

Shopping Time

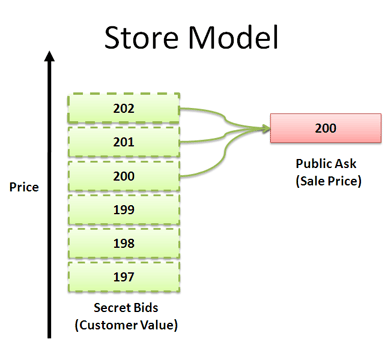
Suppose we want to buy an iPhone from Amazon. You see the selling price of \$200 (Amazon’s ask), and personally decide if it’s worth it (i.e. less than or equal to your bid):

store pricing model

In the store model, Amazon shows a public asking price (\$200). Each buyer has a secret bidding price, some more than others. Buyers willing to bid \$200 or more purchase it; the rest hold off (\$199 and below).

Amazon picks a price that attracts the most bidders yet still keeps a profit. In the store model:

  • Buyer pro: Buyers know the price and can pay less than their internal value
  • Buyer con: Buyers have to visit multiple stores to find the best price
  • Seller con: Sellers don’t know what each buyer is willing to pay; it’s difficult to set the pricing. Do low sales mean a bad price or a bad product?

Even though buyers are “in control”, they may have to search around to find a store that meets their bid (if any). That’s inefficient.

Onto eBay

Now suppose we want to sell our new, unopened gadget (you, the 18-35 demographic, are fickle like that; the survey said so). Sure, we could try to sell it on Amazon — now we’re our own store and need a price we think people will pay. We’re in the same boat as Amazon, and could set the price too low. That’s no fun.

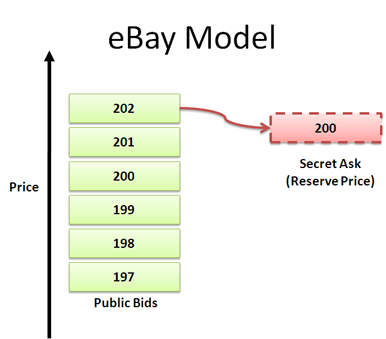
Instead, we auction off the new iPhone on eBay to maximize profits:

ebay pricing model

In the eBay model, buyers have public bids and compete for the product. The seller keeps their minimum price secret and hopes to make a profit by having someone “overpay”. In the auction model:

  • Seller pro: Sellers have a secret ask (reserve or minimum price) and can get paid above this.
  • Seller pro: Buyers’ demand is transparent. They can easily see if they are pricing too high.
  • Buyer con: Difficult to buy a product.

eBay is great for sellers — you have the chance of making extra profit. For buyers, it’s not so great: you can lose auctions by \$1 (paying 201 when 202 was the highest bid), even though the seller would have been happy with 201. You could enter multiple auctions with \$201 but risk getting two iPhones.

Want Ads and Hagglers

There’s other trading approaches also:

  • Want ad: Publicly announce your desire for an iPhone and let sellers fight it out.
  • Haggle: Find someone with an iPhone, and without knowing a selling price, make an offer. You both haggle back and forth, trying to eke the other person out of a few bucks. If you’ve gone car shopping you know how fun this is.

In want ads, the asks are transparent while the bids (your value) are hidden. When haggling, both prices are hidden which can lead to a stressful situation.

It’s About Supply and Demand

Each model has similar concepts, namely:

  • Supply: sellers provide asks
  • Demand: buyers provide bids

The phrase liquidity refers to how effectively you can trade; how easily cash can flow. When buyers and sellers have to argue or haggle, trading freezes up. In particular, there’s a common problem in the market above:

  • There’s secret prices and a lack of transparency
  • There’s multiple vendors and a lack of consolidation

When buyers and sellers need to search to find each other, and haggle when they get there, trading slows down.

Enter the Market

But hope is not lost! Surprisingly, the very symbol of capitalism is an “open source” model:

  • All prices are transparent
  • Buyers write public bids (buying price)
  • Sellers write public asks (selling price)
  • There’s one location to get a particular stock; there’s no searching
  • Dealers/specialists help match buyers and sellers

And here’s what it looks like:

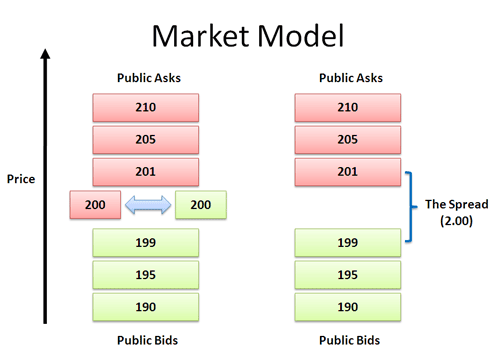
market price model

Every iPhone seller lists their asking price (210, 205, 201, 200). Every iPhone buyer lists their buying price (190, 195, 199, 200). When prices match, a transaction happens: the buyer who wants to pay 200 gets matched with the seller who wants 200. They’re happy.

Eventually the matches cease and we come to a standstill.

Drop and Spread ‘em.

Trades don’t last forever: there’s a standoff and an awkward pause. The lowest sellers want \$201, and the highest bidder wants \$199; this \$2 gap is called the spread. The last price of a transaction was \$200.

Now what happens? Buyers and sellers can do:

  • Limit order: put their bid/ask in the queue.
  • Market order: buy or sell immediately.

When you place a limit order (“Buy an iPhone for 195″), your order gets added to the bid queue (similar for asks).

If you need to trade right now (“buy it now!” or “sell it now!”), then you use a market order. You’ll get the best price available:

  • Market order to sell: You can unload your iPhone for \$199 (the highest bid). The “last” price is now 199.
  • Market order to buy: You can buy for \$201 (the lowest price). The “last” price is now 201.

Now this is interesting. Notice how market orders take items off the queue and change the last price. When people place market orders, the stock price fluctuates. Yes, it’s “just” supply and demand, but it’s pretty cool to know it’s happening real-time in the stock market.

If there’s a lot of buyers, they’ll “use up” the ask queue and the price will rise. If there’s a lot of sellers, they’ll “use up” the bid queue and the price will fall.

This explains why it’s hard to buy and sell for the same price. If you buy for 201, and no new bids come in, you’ll only be able to sell for 199.

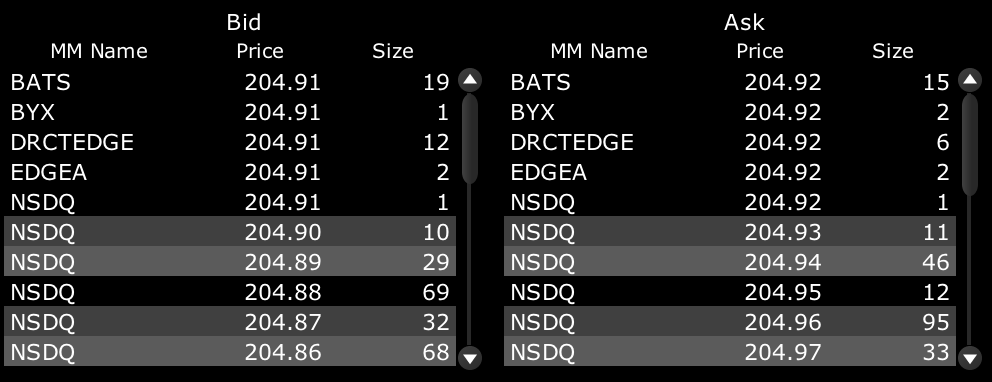
In the real world, the list looks like this:

bid ask market depth SPY

You see the bids, asks, quantities, and names. Here the bid is 204.91 (max someone will pay) and the ask is 204.92 (min someone will sell). When a buyer or seller gets restless, they may decide to immediately buy/sell, which moves the price. This detailed data is called a Level II quote.

So Who Runs This Popsicle Stand?

The NYSE and NASDAQ are the two major American exchanges. There are differences, but at the core they provide:

  • A single market to trade. Originally, all stocks for Microsoft (MSFT), were supposed to be traded on the NASDAQ exchange, and all stocks for Ford (F) on the NYSE. However, there were multiple smaller exchanges ("stores"), and hey -- sometimes trades happened. In 2005, the Regulation National Market System required exchanges to provide the National Best Bid and Offer (NBBO) to get the best price across all exchanges. It's like built-in best-price guarantee when shopping. So, we trade stocks on a single "national" market.
  • A market maker or “specialist” (not the kind that kills people). These people make the market liquid: they help collect and match bids and asks. The NYSE has one specialst per stock; NASDAQ has several market makers (dealers) who compete on price.

How Do They Make Money?

Well, often they don’t. In the NYSE, 88% of the trades happen between the public without needing the specialist (remember those guys waving papers and screaming at each other? I wouldn’t want to get involved with them either).

But sometimes they are needed. The market makers literally “create a market” by providing liquidity: they must always offer stocks for you to buy from them, or sell to them. With many market makers competing for your business, popular stocks get a narrower spread.

But how do market makers make money?

market maker

Well, it’s a bit like a currency exchange at a bank, where’s there’s a different rate for buying and selling. If a steady stream of buyers and sellers transacts at the booth, the exchange pockets the price difference.

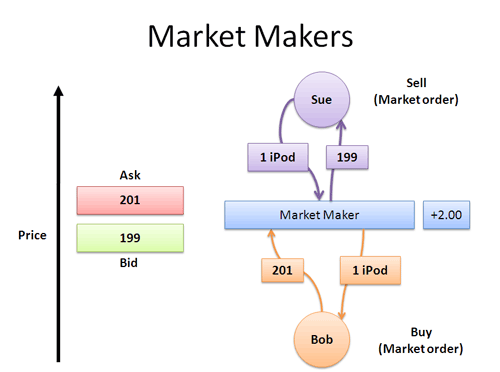
Let’s say Sue has an iPhone to sell, and Bob wants to buy an iPhone. They both want to make an immediate (market) order that's guaranteed to execute. It might go like this:

  • Sue wants to sell her phone, right now. The market maker looks at the buying current price (198), and offers something slightly better. "Hey Sue, I’ll take your iPhone. Here’s 199. The others are only bidding 198."
  • Bob wants to buy a phone, right now. The market maker looks at the current selling price (202), and lists a price that's slightly better. "Hey Bob, I'll sell you a phone for 201. The others are asking 202 for it."

See what happened? The market maker bought an iPhone for 199 and sold it for 201: they pocketed the spread of \$2. However, Sue and Bob got better prices than they would have otherwise.

Market makers are just another market participant, but they are obligated to always list their bid and ask price. But, they are taking some risk: in a volatile market, they may pick up too many shares that they can't sell later. Then, they'd "widen the spread" by listing prices that would help guarantee a profit: perhaps offering to buy at 195 and sell at 205, expecting a steady stream of market orders.

As a regular investor, you can avoid paying the spread by only putting in limit orders. But you aren't guaranteed to make a trade.

It’s All About Timing

Bill Gates has a lot of shares of Microsoft. People naively put this wealth as “shares times price”, but you know that doesn’t really work. If he tried to sell all his shares, he’d use up the bids.

Each block of shares would be sold for a lower and lower value — and potential buyers would panic and reduce their bids, thinking something was amiss. Sellers would fear the worst and lower their asks to compete. Pandemonium would ensue. So the actual liquidation value of his shares is really some fraction of the reported amount. But it’s still nothing to sneeze at.

Similarly, large institutions must spread their stock trades over time so they don’t disrupt the market (and evaporate their profits).

The market has built-in shock absorbers: as you sell more, the price you get is smaller and smaller, so you sell less. As you buy more, the price you pay gets higher and higher, so you buy less. So it makes sense to take things slow. Nifty.

There’s Much to Learn

I’ve simplified a lot of things and only scratched the glossed-over surface. Each market has its own rules to create a trading-friendly environment. Read more here:

  • Invest-faq on the NASDAQ and NYSE. The NYSE is an “auction market” where bids and asks are public (this is different from eBay auctions, where only bidders compete in a given auction). The NASDAQ is a “dealer market” where you buy/sell from a dealer’s personal inventory.
  • Investopedia on the difference between a market maker and specialist
  • See the current bid/ask for Microsoft or Google (and # of shares at that price)

But, my goal wasn’t to fill your head with details. I want to share insight:

  • Markets exist to match supply and demand
  • The stock market is fast, transparent, and efficient
  • Every stock has a bid and ask
  • Buying or selling changes the trading price in a direct, measurable way

Want a stock tip? Don’t listen to stock tips. (Stolen from a Charles Schwab ad.) This article is about looking at a system as one way to solve the larger problem of trading goods. Happy investing.

Join 450k Monthly Readers

Enjoy the article? There's plenty more to help you build a lasting, intuitive understanding of math. Join the newsletter for bonus content and the latest updates.

Understanding the Pareto Principle (The 80/20 Rule)

Originally, the Pareto Principle referred to the observation that 80% of Italy’s wealth belonged to only 20% of the population.

More generally, the Pareto Principle is the observation (not law) that most things in life are not distributed evenly. It can mean all of the following things:

  • 20% of the input creates 80% of the result
  • 20% of the workers produce 80% of the result
  • 20% of the customers create 80% of the revenue
  • 20% of the bugs cause 80% of the crashes
  • 20% of the features cause 80% of the usage
  • And on and on…

But be careful when using this idea! First, there’s a common misconception that the numbers 20 and 80 must add to 100 — they don’t!

20% of the workers could create 10% of the result. Or 50%. Or 80%. Or 99%, or even 100%. Think about it — in a group of 100 workers, 20 could do all the work while the other 80 goof off. In that case, 20% of the workers did 100% of the work. Remember that the 80/20 rule is a rough guide about typical distributions.

Also recognize that the numbers don’t have to be “20%” and “80%” exactly. The key point is that most things in life (effort, reward, output) are not distributed evenly – some contribute more than others.

Life Isn’t Fair

What does it mean when we say “things aren’t distributed evenly”? The key point is that each unit of work (or time) doesn’t contribute the same amount.

In a perfect world, every employee would contribute the same amount, every bug would be equally important, every feature would be equally loved by users. Planning would be so easy.

But that isn’t always the case:

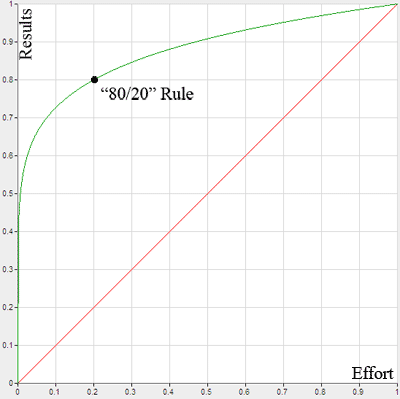
pareto principle graph

The 80/20 rule observes that most things have an unequal distribution. Out of 5 things, perhaps 1 will be “cool”. That cool thing/idea/person will result in majority of the impact of the group (the green line). We’d like life to be like the red line, where every piece contributes equally, but that doesn’t always happen.

Of course, this ratio can change. It could be 80/20, 90/10, or 90/20 (remember, the numbers don’t have to add to 100!).

The key point is that most things are not 1/1, where each unit of “input” (effort, time, labor) contributes exactly the same amount of output.

So Why Is This Useful?

The Pareto Principle helps you realize that the majority of results come from a minority of inputs. Knowing this, if…

20% of workers contribute 80% of results: Focus on rewarding these employees.

20% of bugs contribute 80% of crashes: Focus on fixing these bugs first.

20% of customers contribute 80% of revenue: Focus on satisfying these customers.

The examples go on. The point is to realize that you can often focus your effort on the 20% that makes a difference, instead of the 80% that doesn’t add much.

In economics terms, there is diminishing marginal benefit. This is related to the law of diminishing returns: each additional hour of effort, each extra worker is adding less “oomph” to the final result. By the end, you are spending lots of time on the minor details.

A Fun, Non-Math Example, Please

Everything is nice and rosy in the abstract. I want to give you a real example. Take a look at this awesome video of an artist drawing a car in Microsoft Paint. It’s pretty phenomenal what can be accomplished with such a basic tool:

Now let’s deconstruct this video. It’s about 5 minutes long, so each minute is about 20% of the way to completion (of course the video is sped up, but we are only interested in relative times anyway). Take a look at how the car evolved over time:

pareto principle car example 1 1:06 (Level 1) – Wireframe
pareto principle car example 2 2:00 (Level 2) – Basic coloring
pareto principle car example 3 3:05 (Level 3) – Beginning details: rims, windshield
pareto principle car example 4 4:04 (Level 4) – Advanced details: shading, reflections
pareto principle car example 5 5:05 (Level 5) – Finishing touches: headlights, background

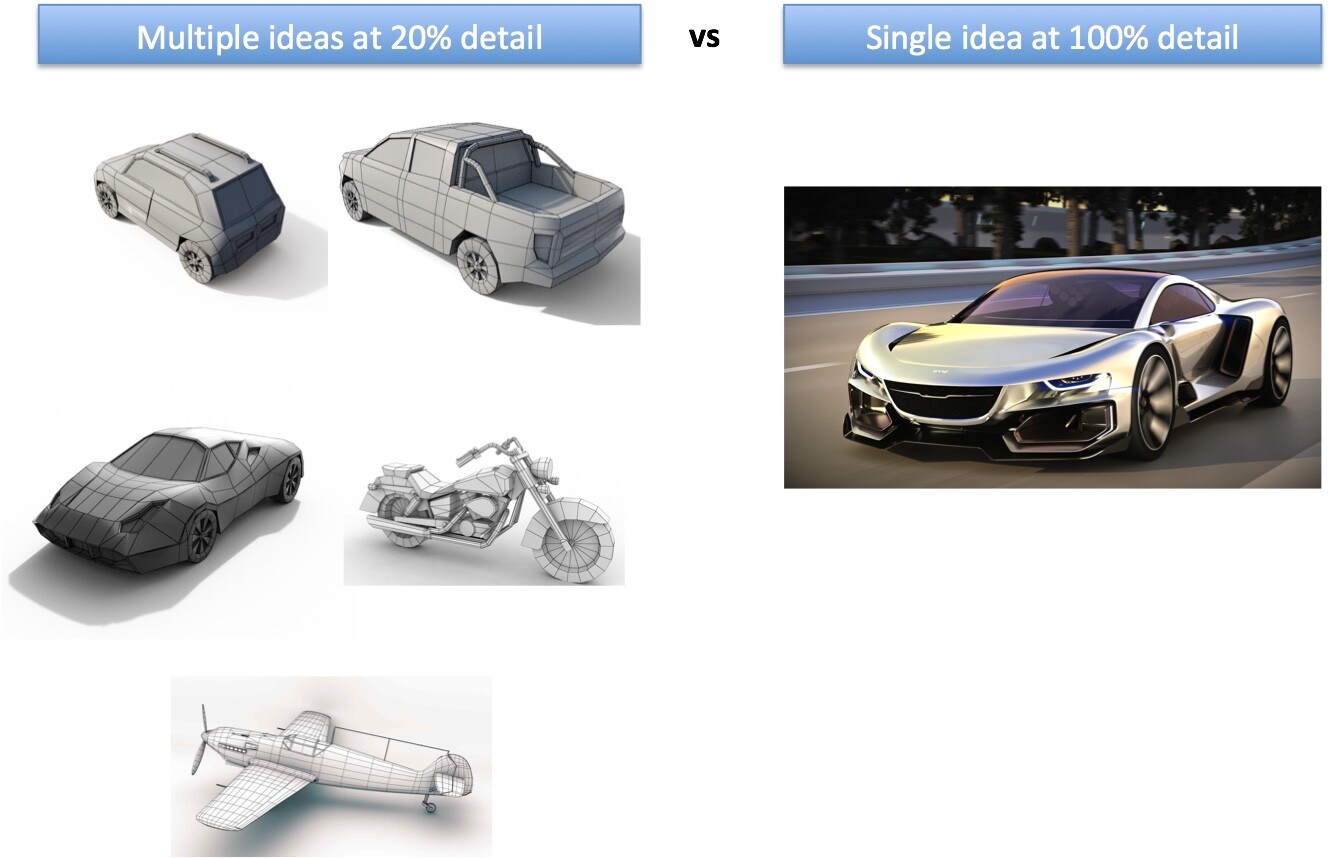
Now, let’s say the artist was creating potential designs for a client. Given 5 minutes of time, he could present:

  • A single car at top quality (Level 5)
  • A reasonably detailed car (Level 3) and a colorized wireframe (Level 2)
  • 5 cars at a wireframe level (5 Level 1s)

“But Level 5 is way better than Level 1!” someone will inevitably shout.

The point isn’t that Level 5 is better than Level 1 — it clearly is. The question is whether a single Level 5 is better than five Level 1s, or some other combination.

Let’s say your customer doesn’t know whether they want a car, a truck, or a boat, let alone the color. Spending the time to create a Level 5 drawing wouldn’t make sense — show some concepts, get a general direction, and then work out the details.

Understanding the Pareto Principle (The 80/20 Rule)

The point is to put in the amount of effort needed to get the most bang for your buck — it’s usually in the first 20% (or 10%, or 30% — the exact amount can vary). In the planning stage, it may be better to get 5 fast prototypes rather than 1 polished product.

In this example, after 1 minute (20% of the time) we have a great understanding of what the final outcome will be. Most of the “work” is done up front, in the sense of deciding the type of vehicle, body style, and perspective. The rest is “filling in details” like colors and shading.

This isn’t to say the details are easy — they’re not — but each detail does not add as much to the picture as the broad strokes in the beginning. The difference between #4 and #5 is not as great as #1 and #2, or better yet, a blank drawing and #1 (the time from 0:00 to 1:06). You really have to look to see the differences on the car between #4 and #5, while the contribution #1 makes is quite obvious.

Concluding Thoughts

This may not be the best strategy in every case. The point of the Pareto principle is to recognize that most things in life are not distributed evenly. Make decisions on allocating time, resources and effort based on this:

  • Instead of spending 1 hour drafting a paper/blog post you’re not sure is needed, spend 10 minutes thinking of ideas. Then spend 50 minutes writing about the best one.
  • Instead of agonizing 3 hours on a single design, make 6 layouts (30 minutes each) and pick your favorite.
  • Rather than spending 3 hours to read 3 articles in depth, spend 5 minutes glancing through 12 articles (1 hour) and then spend an hour each on the two best ones (2 hours).

These techniques may or may not make sense – the point is to realize you have the option to focus on the important 20%.

Lastly, don’t think the Pareto Principle means only do 80% of the work needed. It may be true that 80% of a bridge is built in the first 20% of the time, but you still need the rest of the bridge in order for it to work. It may be true that 80% of the Mona Lisa was painted in the first 20% of the time, but it wouldn’t be the masterpiece it is without all the details. The Pareto Principle is an observation, not a law of nature.

When you are seeking top quality, you need all 100%. When you are trying to optimize your bang for the buck, focusing on the critical 20% is a time-saver. See what activities generate the most results and give them your appropriate attention.

Join 450k Monthly Readers

Enjoy the article? There's plenty more to help you build a lasting, intuitive understanding of math. Join the newsletter for bonus content and the latest updates.

Combining Simplicity and Complexity

There’s an ongoing debate about the merits of simplicity vs. complexity. “People want things simple and easy to use!” proclaim some.

“Balderdash – they want complex and powerful behavior!” exclaims the other side. And back and forth they argue, gnashing teeth and brandishing keyboards.

I think the problem lies in the confusion of terminology, which the authors hint at but don’t state explicitly. Pitting simplicity against complexity in a virtual cage match creates a false dichotomy, or the belief that you must choose one or the other. Both are possible.

This isn’t a cop-out, “can’t we all just get along” answer. I think the real issue is that we are mixing terms. Simplicity and complexity really can be friends, and don’t have to fight to the death (like Kirk and Spock they are best friends, and even if they do fight it’s only a charade).

When we argue about a thing being simple or complex, we are unknowingly asking two higher questions:

  • How easy is it to understand?
  • What can it do?

These are the questions we ineffectively try to answer using the words “simple” and “complex”. Unfortunately two words aren’t enough; we need four to answers these two questions:

How easy is it to understand?

  • Simple: Easy to understand, straightfoward
  • Complicated: Difficult to understand, convoluted

What can it do?

  • Advanced: Does a lot, powerful
  • Basic: Doesn’t do much, simplistic

Framing the problem this way lets us separate out the good and bad answer for each question.

Being simple or complex is a good thing. Being simplistic is an ok thing. Being complicated is a bad thing. Let’s see why.

Case 1: Simple and Basic

Simple and basic is the stereotype of simple: We think that if something is easy to understand, it isn’t capable of much.

This is true a lot of the time. Think about a rock, an oar, or a spoon. These are basic tools and easy to use, though they don’t seem to accomplish much. In software world we have notepad: it’s easy to understand, but not very powerful (no spell checking, embedded graphics, etc.).

notepad.PNG

Are simple, simplistic things good? You bet. They get their (simple) job done. And their ease of understanding is a great benefit: it’s excellent for education purposes, and often times we don’t need the power we think we do. In fact, having simple behavior often leads to increased reliability — how often does an oar “break down” compared to an engine?

Also, there’s nothing stopping you from taking multiple “weak” items to create a powerful one, like using thin threads to make a thick rope. I’ll touch on this later.

Rocks, spoons, and notepad are fine in my book: they have their uses.

Case 2: Complicated and Basic

Ah, now this is a strange beast. What item could be hard to understand yet not accomplish much?

A Rube Goldberg machine. It’s a contraption built for a basic task, such as lowering a sign, using absurdly convoluted and intricate means. Here’s what I mean:

These devices are complicated (can you immediately tell what it will do?) and basic (lowering a sign isn’t very awe-inspiring). They stink from a practical viewpoint, though they do have redeeming value for entertainment, artistic or educational purposes (how not to build a device).

Unfortunately some software is like a Rube Goldberg machine, like setting the clock on your VCR. Setting the clock should be a simple task, but it often involves a complicated, unweidly procedure because the interface of a VCR is not designed for it (“Press channel up to pick the date…”).

Strangely enough, people don’t seem to get entertainment value from seeing how complicated this is. They get frustrated, which is a bad thing. Items in this category should be avoided.

Case 3: Complicated and Advanced

This is the stereotype of most powerful devices: Sure, they can do a lot, but they are really hard to use.

A real-life example is a helicopter. It can fly straight up, backwards, and manuever in any way imaginable: it’s extremely powerful. Unfortunately, you need extensive training in order to operate one. I’ve never flown in one, but apparently it requires the use of all 4 limbs and your brain in order to operate it.

helicopter.jpg

Items in this realm are often on the cutting-edge. They are our most advanced technology that works, but we are still in the process of figuring it out, discovering patterns and optimizations that make it easier to use.

Computers were originally complicated and advanced. Early computers were powerful (they could perform any computation, albeit slowly), but were very hard to use. You had to use punch cards or even enter information manually using switches. As time went on, we developed keyboards, graphical interfaces, and better programming languages. We were able to input instructions in a more simple (easy to understand) manner.

Programming is still not dead-simple: simplicity and ease of use is a range. But it’s clear that computers are vastly simpler (easier to use) than they used to be. The underlying technology, microchips, has become more advanced (powerful) and also more complicated (difficult to understand) in order to make computers simpler. There was a time when a single person could understand a microchip or operating system — no longer.

Complicated and advanced devices are “ok” — they do get the difficult jobs done, but when using them you often think there’s got to be a better way. And there often is.

Case 4: Simple and Advanced

Ah, this is the holy grail. This is what mathematicians seek by “elegant” equations, what scientists yearn for with beautiful theories, what designers seek when creating products. Consider Einstein’s famous equation:

\displaystyle{E = mc^2}

Energy and matter are equivalent – you can convert one into the other. This concept is astonishingly easy to understand (simple) yet describes extremely powerful behavior (nuclear reactions). Many physics equations are like this: Gravity, Newton’s laws or Maxwell’s equations. They are 1-liners that guide us through powerful behavior, the workings of our universe.

Google is a simple interface for incredibly powerful behavior — finding any document on the Web. The ipod (I’ve never owned one) is claimed to be an amazingly simple device to manage and play music. Even programming can be like this: A Turing machine is a simple model of computation (writing symbols on a ticker tape) that can do the same calculations we can perform on a modern computer. Heck, MacGyver can create a bomb out of simple, basic parts like a toothpick, comb and bottle of shampoo.

Use Simple Building Blocks

Advanced behavior often comes from simple parts. The beauty of the Unix design philosophy was to have many simple, even basic programs that did a single task well: combining files, sorting them, counting lines or searching for words. Each tool was basic, but when linked via “pipes” could lead to very powerful behavior. If you are a programmer, I urge you to learn about Unix if you don’t already.

Much of the world is made from simple, easy-to-understand building blocks. Simple atoms make any object. Simple DNA (only 4 bases) is stretched into long sequences, creating the instructions needed to make a human being. The most intricate video file is still a sequence of 1′s and 0′s.

It didn’t have to be this way. We could have had thousands of elements in the periodic table. DNA could have had millions of different bases. We could have designed computers to store files with 0′s, 1′s and 2′s.

But that’s not what happened. The best-designed, most elegant systems are simple and advanced. Simplicity gives them reliability, and a clever arrangement of parts gives them power.

Simple Isn’t Easy

There’s one giant caveat here: “easy to understand” does not mean “easy to do”. Running a marathon is easy to understand. It is not easy to do. Similarly, actually creating powerful behavior from the easy-to-understand parts can be a challenge.

It’s tough to find underlying patterns in chaotic, complicated behaviors. It’s easy to get something working and leave it at that. But looking at our natural laws, there’s inspiration that nearly any complex phenomenon or design can be built simply.

Parting Thoughts

Have I resolved the debate? You be the judge. To me, simplicity and complexity coexist peacefully by thinking about two separate questions:

1) How easy is it to understand?

2) What can it do?

Don’t confuse a simple interface with basic behavior. Don’t assume a complicated device is powerful. Think about these questions independently and you’ll be fine.

Join 450k Monthly Readers

Enjoy the article? There's plenty more to help you build a lasting, intuitive understanding of math. Join the newsletter for bonus content and the latest updates.

The Rule of 72

The Rule of 72 is a great mental math shortcut to estimate the effect of any growth rate, from quick financial calculations to population estimates. Here’s the formula:

Years to double = 72 / Interest Rate

This formula is useful for financial estimates and understanding the nature of compound interest. Examples:

  • At 6% interest, your money takes 72/6 or 12 years to double.
  • To double your money in 10 years, get an interest rate of 72/10 or 7.2%.
  • If your country’s GDP grows at 3% a year, the economy doubles in 72/3 or 24 years.
  • If your growth slips to 2%, it will double in 36 years. If growth increases to 4%, the economy doubles in 18 years. Given the speed at which technology develops, shaving years off your growth time could be very important.

You can also use the rule of 72 for expenses like inflation or interest:

  • If inflation rates go from 2% to 3%, your money will lose half its value in 24 years instead of 36.
  • If college tuition increases at 5% per year (which is faster than inflation), tuition costs will double in 72/5 or about 14.4 years. If you pay 15% interest on your credit cards, the amount you owe will double in only 72/15 or 4.8 years!

The rule of 72 shows why a “small” 1% difference in inflation or GDP expansion has a huge effect in forecasting models.

By the way, the Rule of 72 applies to anything that grows, including population. Can you see why a population growth rate of 3% vs 2% could be a huge problem for planning? Instead of needing to double your capacity in 36 years, you only have 24. Twelve years were shaved off your schedule with one percentage point.

Deriving the Formula

Half the fun in using this magic formula is seeing how it’s made. Our goal is to figure out how long it takes for some money (or something else) to double at a certain interest rate.

Let’s start with \$1 since it’s easy to work with (the exact value doesn’t matter). So, suppose we have \$1 and a yearly interest rate R. After one year we have:

1 * (1+R)

For example, at 10% interest, we’d have \$1 * (1 + 0.1) = \$1.10 at the end of the year. After 2 years, we’d have

1 * (1+R) * (1+R) = 1 * (1+R)^2

And at 10% interest, we have \$1 * (1.1)2 = \$1.21 at the end of year 2. Notice how the dime we earned the first year starts earning money on its own (a penny). Next year we create another dime that starts making pennies for us, along with the small amount the first penny contributes. As Ben Franklin said: “The money that money earns, earns money”, or “The dime the dollar earned, earns a penny.” Cool, huh?

This deceptively small, cumulative growth makes compound interest extremely powerful – Einstein called it one of the most powerful forces in the universe.

Extending this year after year, after N years we have

1 * (1+R)^N

Now, we need to find how long it takes to double — that is, get to 2 dollars. The equation becomes:

1 * (1+R)^N = 2

Basically: How many years at R% interest does it take to get to 2? Not too hard, right? Let’s get to work on this sucka and find N:

1: 1 * (1+R)^N = 2
2: (1+R)^N = 2
3: ln( (1+R)^N ) = ln(2) [natural log of both sides]
4: N * ln(1+R) = .693
5: N * R = .693 [For small R, ln(1+R) ~ R]
6: N = .693 / R

There’s a little trickery on line 5. We use an approximation to say that ln(1+R) = R. It’s pretty close – even at R = .25 the approximation is 10% accurate (check accuracy here). As you use bigger rates, the accuracy will get worse.

Now let’s clean up the formula a bit. We want to use R as an integer (3) rather than a decimal (.03), so we multiply the right hand side by 100:

N = 69.3 / R

There’s one last step: 69.3 is nice and all, but not easily divisible. 72 is closeby, and has many more factors (2, 3, 4, 6, 12…). So the rule of 72 it is. Sorry 69.3, we hardly knew ye. (We could use 70, but again, 72 is nearby and even more divisible; for a mental shortcut, go with the number easiest to divide.)

Extra Credit

Derive a similar rule for tripling your money – just start with

1 * (1+R)^N = 3

Give it a go – if you get stuck, see the rule of 72 for any factor.

Happy math.

A Note On Accuracy

From Colin’s comment on Hacker News, the Rule of 72 works because it’s on the “right side” of 100*ln(2).

100*ln(2) is ~69.3, and 72 rounds up to the bigger side. This is a great choice because the series expansion of r * ln(2) / ln(1 + r/100) is:

taylor series rule of 72

This series expansion is the Calculus Way of showing how far the initial estimate strays from the actual result. The first correction term $\frac{1}{2} r \log(2)$ is small but grows with r. 72 is on the “right side” because it helps us stay in the accurate zone for longer. Neat insight!

Join 450k Monthly Readers

Enjoy the article? There's plenty more to help you build a lasting, intuitive understanding of math. Join the newsletter for bonus content and the latest updates.